Modelling sand wave-induced form roughness: The complexity of a tidal setting
L. Portos-Amill1*, P.C. Roos1, J.H. Damveld1, S.J.M.H. Hulscher1
1 Water Engineering and Management, University of Twente, The Netherlands
* Corresponding author: l.portosamill@utwente.nl
Introduction
Tidal sand waves are abundantly present in tide-dominated sandy shelf seas, such as the Dutch North Sea. They exhibit different characteristics (wavelengths of 100-1000 m, heights of 1-10 m, and migration rates of 1-10 m/yr; van Dijk & Kleinhans,2005). Yet, bedform information is generally not considered in basin-scale hydrodynamic models, such as the Dutch Continental Shelf Model (DCSM) of the North Sea. The grid sizes of such models are too coarse to resolve individual sand waves. However, the presence of sand waves may be implicitly included in the roughness coefficient (i.e., form roughness), which would introduce a more realistic and physics-based element into these kind of models. Instead, the bed roughness of these models is obtained from calibration against observations of tidal sea surface elevation (Zijl et al., 2023), leading to large differences in bed roughness in space, which lack a physical explanation.
Form roughness parametrizations have been widely studied in river settings for river dunes and ripples (Lefebvre & Winter, 2016; van Rijn, 1993). However, the tide, unlike a unidirectional flow, is characterised by several constituents, each expressed in terms of an amplitude and a phase. Thus, the study of form roughness in a tidal setting demands a more refined analysis than in a fluvial (unidirectional) setting.
Objective and Methods
The aim of the present research is (1) to extend the concept of form roughness to a tidal setting and (2) to assess how sand wave-induced form roughness depends on bedform characteristics (wavelength, height, asymmetry). To this end, we use two hydrodynamic models: a second order perturbation approach (PA) and Delft3D.
The overall principle behind the methodology used for both models is identical. We compare a model run that explicitly includes sand waves, with one with a flat bed and an increased roughness. The increase in roughness needed for both runs to be equivalent is thus the form roughness.
We force our simulations with an M2 tide and compute the increase in roughness needed such that the M2 phase or amplitude of the depth-averaged flow are the same for the sand wave situation and the flat bed situation with an increased roughness. Importantly, this leads to two sand wave-induced form roughness values for the PA: amplitude-based and phase-based for the depth-averaged flow. Additionally, Delft3D allows for the study of the sea surface elevation. Thus, with Delft3D we can compute sand wave-induced roughness values based on four different equivalence criteria: amplitude-based or phase-based for both the depth-averaged flow and the sea surface elevation.
Results
Results show that the presence of sand waves causes a phase shift of the depth-averaged flow and sea surface elevation signals, as well as an amplitude decrease. These variations of the flow and sea surface elevation can be reproduced by a flat bed simulation with an increased roughness, but not all at once. Thus, it is not possible to reproduce the depth-averaged flow (or sea surface elevation) signal as a whole with an increased roughness, but only its M2 phase or amplitude. This demonstrates the added complexity of a tidal setting with respect to a fluvial setting.
Furthermore, we studied the dependence of sand wave-induced form roughness on sand wave characteristics by running sand wave simulations with different height, wavelength or asymmetry (latter not shown), and keeping the default values for the other characteristics (symmetric sand wave of 4 m in height and 350 m in wavelength). Both models yield the same qualitative results: higher and shorter sand waves produce a higher value for the form roughness. Yet, results obtained with the PA are one order of magnitude lower than with Delft3D, meaning that it is the more complex processes included only in Delft3D that result in the main source of roughness.
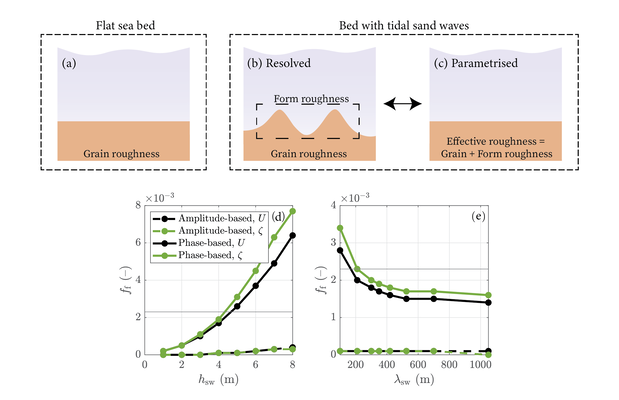
Top: schematic representation of sand wave-induced form roughness: (a) the roughness that the flow experiences over a flat bed is purely due to grain roughness. Sand waves add additional roughness to the seabed, which can be modelled either by (b) resolving the sand waves or (c) imposing an increased effective roughness over a flat bed. Bottom: Form roughness obtained from Delft3D simulations (ff) in terms of (d) sand wave height and (e) wavelength. Thin black line corresponds to the grain roughness.
References
Lefebvre, A., & Winter, C. (2016). Predicting bed form roughness: the influence of lee side angle. Geo-Marine Letters, 36, 121-133.
Van Dijk, T. A., & Kleinhans, M. G. (2005). Processes controlling the dynamics of compound sand waves in the North Sea, Netherlands. Journal of Geophysical Research: Earth Surface, 110(F4).
Van Rijn, L. C. (2008). Effective bed roughness. In Principles of sediment transport in rivers, estuaries, coastal seas and oceans. Amsterdam, The Netherlands: Aqua Publications.
Zijl, F., Zijlker, T., Laan, S., & Groenenboom, J. (2023). 3D DCSM FM: a sixth-generation model for the NW European Shelf. Technical report, Deltares 2023.
Simulating 3D Sand Wave Recovery After Pre-sweeping in Delft3D FM
Z. T. F. Tam1,2*, P. H. P. Overes2,3 , A. P. Luijendijk1,2, A. J. H. M. Reniers1
1 Delft University of Technology; 2 Deltares; 3 University of Twente
* Corresponding author: zeta.tam@deltares.nl
Introduction
Sand waves are one of the large-scale seabed morphological features, with a typical wave height of metres and a wavelength of hundreds of metres. Their mobile nature causes a risk to offshore infrastructure and marine transport. Pre-sweeping is a construction procedure commonly involved in submarine utilities installation to dredge existing sand waves and thereby reduce their impact to the utilities. Nevertheless, recovery of sand waves is usually observed after dredging and the underlying processes of sand wave recovery remain relatively underexplored. Current models predicting sand wave recovery are limited to empirical relations or 2DV model applications. Considering the accelerating offshore infrastructure development at present, more understanding on the interaction between offshore morphology and human intervention, together with the development of an effective prediction tool, will markedly optimise dredging planning.
Objective and Methods
This study aims to investigate the drivers of sand wave recovery and examine the modelling performance of Delft3D Flexible Mesh (FM) on the recovery process through a case study. A location in the Southern North Sea was studied and a 3D FM model was applied to replicate the sand wave recovery observed in the case study. This model is the first 3D morphological model specifically for simulating sand wave recovery after pre-sweeping with a high resolution of 2m.
Results
The results show that the transverse slope effect and the oblique current flow supply sediment into the dredged area causing fill-in and sand wave recovery. This study also elaborates on the two stages in the recovery: an adaption period referring to the morphological adaption of the dredged profile in response to the forcing and a subsequent regeneration period referring to the growth of a feature developed during the adaption period. With the incorporation of supercomputer and MORFAC, this three-year recovery process was able to be simulated in a high-resolution 3D model within one day in wall-clock time.
Although the precise estimation of the computed recovery duration remains challenging, this pioneering research provides an explanation on how tidal flow drives the recovery. In addition, it demonstrates the unique capabilities of Delft3D FM in modelling this complex phenomenon efficiently.
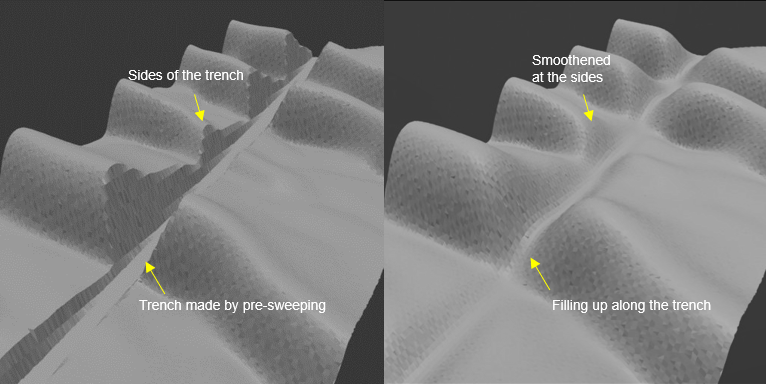
Figure 1: Sand waves in the study area in Delft3D FM model before (left) and after (right) the simulation (vertical scale is exaggerated for better illustration.)
Storm-driven migration of tidal sand waves: analysis of high resolution bathymetric data
J.H. Damveld1*, B.W. Borsje1 , S.J.M.H. Hulscher1
1 University of Twente, Netherlands
* Corresponding author: j.h.damveld@utwente.nl
Introduction
The seabed of coastal shelf seas, such as the North Sea, consist of various rhythmic bed patterns (van der Meijden et al, 2023). Sand banks, oriented parallel to the main tidal current, have spacings of kilometres and heights of tens of metres. Sand waves, oriented perpendicular to the tidal current, are smaller with spacings of hundreds of meters and heights up to 10 metres. In particular these sand waves are relevant for offshore engineering as, on average, they migrate several metres per year, thereby exposing cables/pipelines and other objects on the seafloor. It is therefore essential to understand their dynamic behaviour in order to realistically predict the dimensions and migration rates of sand waves.
The migration of sand waves is commonly determined by measuring the crest displacement taken from seabed surveys. However, as these surveys generally have intervals of several years, migration due to short-term effects is not captured in the data. In the scarcely available data that have a high temporal resolution (e.g. van Dijk et al, 2005), striking nonlinear effects (negative migration, shape changes, flattening) are observed after storms.
Objective and Methods
Given the relevance for engineering and the limited knowledge on wind-driven migration of sand waves, there is a need for new seabed datasets with a high spatial and temporal resolution. Recently, the Dutch Hydrographic Service, responsible for seafloor measurements, have surveyed a shipping lane in the North Sea (see figure). As the entire area was surveyed over a period of almost one year, adjacent survey tracks are recorded with intervals of days to weeks. Because the survey tracks are required to partly overlap in order to get full spatial coverage, episodical sand wave migration can be detected from these overlapping areas. In combination with a high spatial data resolution of 1 m, this creates a unique dataset.
First, a lowpass filter is applied to the raw data to separate the superimposed megaripples from the sand waves. Then, using cross-correlation the migration in the direction of the transect was determined. The resulting migration rates per survey interval were subsequently compared to the wave climate on the North Sea, quantified through the Shields parameter.
Results
Analysis of the results show relatively low sand wave migration within the relatively short survey windows. For the longest survey window, extrapolated to yearly rates, migration of a few meters per year in north-eastern direction are recorded. This corresponds to historical long-term surveys in that same area. When focussing on shorter time intervals, consistent migration rates are not present. However, sand wave shapes are clearly affected during period of increased wave energy. Sand waves tend to be lower in some locations, in particular the crests. Also, the secondary bed forms (ripples and megaripples) are affected, being lower and longer than during calm conditions.
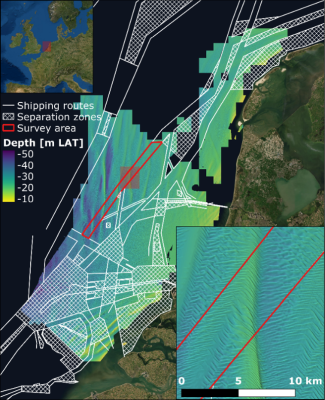
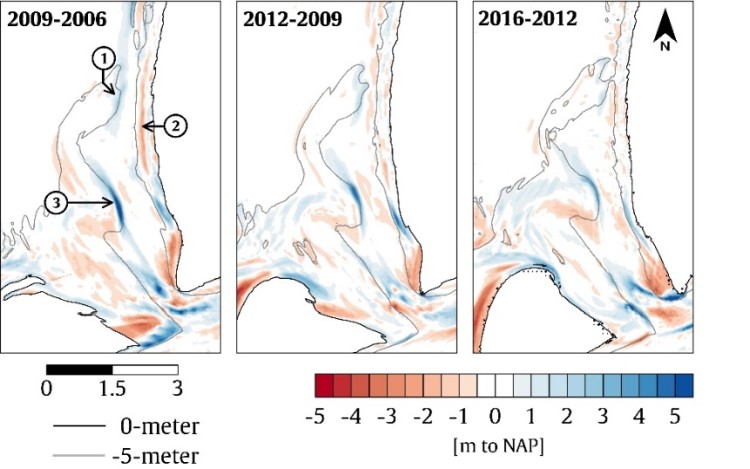
Bathymetry of the Netherlands Continental Shelf. Data from the Dutch Royal Navy.
References
van Dijk, T. A. G. P., & Kleinhans, M. G. (2005). Processes controlling the dynamics of compound sand waves in the North Sea, Netherlands. Journal of Geophysical Research: Earth Surface. doi:10.1029/2004JF000173
van der Meijden, R., Damveld, J. H., Ecclestone, D. W., Van der Werf, J. J., & Roos, P. C. (2023). Shelf-wide analyses of sand wave migration using GIS: A case study on the Netherlands Continental Shelf. Geomorphology, 424, 108559. doi:10.1016/j.geomorph.2022.108559
Tipping dynamics in estuarine bedforms under high flow conditions
R.C. van de Vijsel1*, S.I. de Lange1, P.J.J.F. Torfs2, A.J.F. Hoitink
1 Hydrology and Environmental Hydraulics Group, Wageningen University, The Netherlands; 2 Independent researcher
* Corresponding author: roeland.vandevijsel@wur.nl
Introduction
Estuarine bedforms affect bed roughness and, with that, hydrodynamics and sediment transport. With increasing flow velocity, subaqueous bedforms grow from flat beds to ripples to dunes, before diminishing again to an upper stage plane bed. Previous studies report an increase in the standard deviation of bedform height with increasing transport stage (a measure of flow strength), and rapid switches in time between contrasting bed configurations (Figure 1).
Objective and Methods
Not much attention has been given to this phenomenon despite its importance in, for example, flood prediction. Our study (de Lange et al. 2023) reanalyzes experimental data from two earlier experimental studies (Venditti et al. 2016, Bradley & Venditti 2019).
Results
We show that there are statistically strong indications that the increase in standard deviation is due to the emergence of bimodal distributions in bedform height for transport stages larger than 18. This is consistent with our understanding of the physics, as time series of observed dune heights exhibit flickering between low and high dunes, suggesting critical transitions between two alternative morphological states.
We hypothesize that local sediment outbursts drive temporary shifts from suspended- to bed load conditions, causing dunes to form transiently before returning to an upper stage plane bed. Flickering behavior of dunes at high transport stages implies that one single snapshot is not enough to capture the state of a system, with far-reaching implications for field measurements and experimental designs. The possibility of alternative dune states also calls for a reconsideration of classical equilibrium relations. This study implies a presence of tipping points in geomorphology and calls for further research to understand and quantify flickering behavior in estuarine sediment beds at high transport stages.
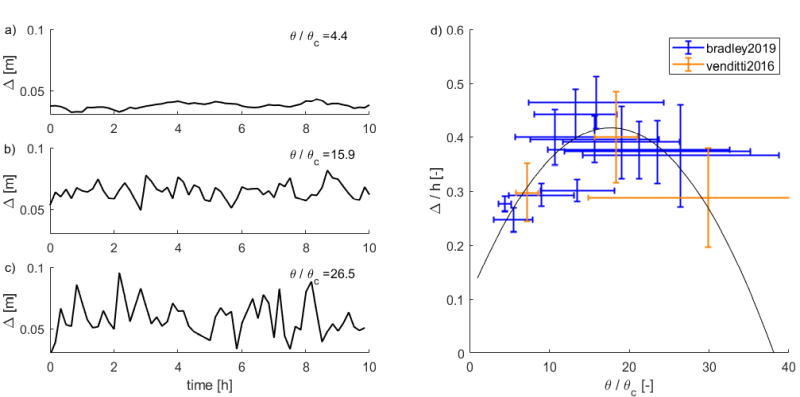
Figure 1. a-c) Dune height Δ over time for three experiments of Bradley & Venditti (2019), for three different transport stages θ/θc (i.e., bed shear stress divided by critical shear stress). d) Variability in non-dimensional dune height Δ/h increases with transport stage. Here, h is time-averaged water depth. The dune height predictor of Venditti & Bradley (2022) is shown as a black parabola. Colored error bars indicate standard deviation for the experiments of Venditti et al. (2016) (orange) and Bradley & Venditti (2019) (blue).
References
Bradley, R.W., & Venditti, J.G. (2019). Transport scaling of dune dimensions in shallow flows. Journal of Geophysical Research: Earth Surface, 124(2), 526-547.
de Lange, S.I., van de Vijsel, R.C., Torfs, P.J.J.F., & Hoitink, A.J.F. (2023). Alternative stable river bed states at high flow. Authorea Preprints.
Venditti, J.G., & Bradley, R.W. (2022). Bedforms in sand bed rivers.
Venditti, J.G., Lin, C.Y.M., & Kazemi, M. (2016). Variability in bedform morphology and kinematics with transport stage. Sedimentology, 63(4), 1017-1040.
Calculating sand wave-induced form roughness coefficients for a section of the Netherlands Continental Shelf.
C.H. Bedon Pineda1*, L. Portos-Amill1, P.C. Roos1
1 Water Engineering and Management, University of Twente, The Netherlands
* Corresponding author: c.h.bedonpineda@student.utwente.nl
Introduction
Coastal environments exhibit various bedforms, with sand waves being of particular interest due to their influence on flow, sediment transport, and morphology (van der Meijden et al., 2023). While numerous models simulate tidal flow, none explicitly includes form roughness induced by these sand wave fields. For instance, the roughness coefficient in the Dutch Continental Shelf Model (DCSM) is calibrated solely to match observed water levels. Portos-Amill et al.'s (submitted) process-based modelling approach addresses this gap by quantifying form roughness induced by sand waves, based on water depth, tidal flow amplitude, grain size, and sand wave characteristics. This provides four criteria to compute form roughness value; either amplitude-based or phase-based, to match the M2 depth-averaged flow or sea surface elevation. The resulting roughness may vary depending on the criterion chosen, highlighting the complex interactions between sand waves and tidal currents.
Objective and Methods
The objective of this research is to calculate the values of the effective roughness coefficient for a section of the Netherlands Continental Shelf that represents the depth-averaged flow or sea surface elevation in the presence of sand waves. To this end, data on M2 tidal amplitudes, mean water depth, mean grain size, and sand wave dimensions were retrieved from Damen et al. (2018) and refined for smoother visualization. Six study areas of 22.2x44.4 km2 were selected based on similar sand wave characteristics and the mean values of each parameter were calculated. Only one out of the six was further studied due to time limitations. Next, the 2DV Delft3D model by Portos-Amill et al. (submitted) was used to calculate the form roughness value. The model initially resolves the hydrodynamics over a sand wave field and then iterative runs are carried out with increased effective roughness over a flat bed to identify the roughness coefficient that is most representative to match the amplitude or phase of the M2 depth-averaged flow or sea surface elevation for the situation that includes the sand waves. Thus, the difference between the increased effective roughness and the grain-induced roughness provides the form roughness.
Results
The chosen study area (52.1° to 52.3° latitude and 3° to 3.4° longitude) corresponds to the zone with the highest Manning coefficients (0.037 s/m1/3) surrounded by relatively low values in the DCSM (Figure 1a). The effective roughness coefficient values to better represent the amplitude of the M2 depth-averaged flow and sea surface elevation is 0.029 s/m1/3. Contrarily, the phase-based criteria yield a value of 0.036 s/m1/3 for both the flow and sea surface elevation. Notably, neither matches the current value used in the DCSM, although the phase-based coefficient is relatively similar. This difference, however, leads to a different pattern in the M2 depth-averaged flow (Figure 1b) and the sea surface elevation. Moreover, the amplitude-based roughness coefficients, are more similar to the neighbouring roughness coefficients in the DCSM. These results demonstrate the inherent complexity of simulating tidal flow over a sand wave field. Highlighting the importance of deciding on the specific criterion (either amplitude-based or phase-based, to match the M2 depth-averaged flow or sea surface elevation) that will guide the calibration of tide-influenced models.
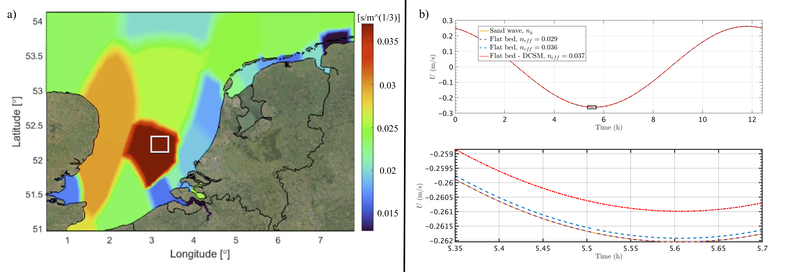
Figure 1. (a) Roughness values used in the DCSM (retrieved from Zijl et al., (2022)). The white box indicates the study area. (b) Depth-averaged flow for sand wave simulation compared to flatbed simulation with the form roughness coefficients obtained for the amplitude and phase-based criteria, and the coefficient currently used in the DCSM: (Top) Complete M2 tidal period. (Bottom) The zoomed-in region as showed in the top plot.
References
Damen, J. M., van Dijk, T. A. G. P., & Hulscher, S. J. M. H. (2018). Spatially Varying Environmental Properties Controlling Observed Sand Wave Morphology. Journal of Geophysical Research: Earth Surface, 123(2), 262–280. https://doi.org/10.1002/2017JF004322
Portos-Amill, L., Roos, P. C., Damveld, J. H., & Hulscher, S. J. M. H. (submitted). Modelling form roughness induced by tidal sand waves.
van der Meijden, R., Damveld, J. H., Ecclestone, D. W., van der Werf, J. J., & Roos, P. C. (2023). Shelf-wide analyses of sand wave migration using GIS: A case study on the Netherlands Continental Shelf. Geomorphology, 424, 108559. https://doi.org/10.1016/j.geomorph.2022.108559
Zijl, F., Zijlker, T., Laan, S., & Groenenboom, J. (2022). 3D DCSM FM: a sixth-generation model for the NW European Shelf. Deltares.
Large-Scale Sand Extraction on the Netherlands Continental Shelf: a Surficial Wound or a Deep Scar?
W. Ploeg1*, P.C. Roos1, B.W. Borsje1, S.J.M.H. Hulscher1
1 University of Twente, The Netherlands
* Corresponding author: w.ploeg@utwente.nl
Introduction
Due to rising sea levels, the amount of sediment extracted from the Netherlands Continental Shelf (NCS) is expected to (at least) double for coastal defence in 2100 compared to the current extraction rates (Deltacommissie, 2008). To make more efficient use of the limited space and sediment supply on the NCS, a new extraction strategy has been formulated that focuses on deep extractions (MIenW et al., 2014). In line with this, the average extraction depth increased to eight meters in the past decade (MIenW et al., 2022). The impact of these pits may be profound: bed features like sand waves may not recover after dredging (Krabbendam et al., 2022), sediment properties may change to contain finer and more cohesive sediments and the benthos are likely to be affected directly and indirectly due to the extraction (Witbaard & Craeymeersch, 2023). However, present studies were all constrained to a single component of the system or studied the coupled system from observations. Therefore, this study aims to explore and predict the coupled interactions between bed forms, sediment composition and benthic organisms and their response to deep sand extraction.
Objective and Methods
Two idealised, process-based numerical models are employed to unravel key interactions in the coupled system and to explore the influences of various pit design parameters on these dynamics. Firstly, a linearized model is applied to investigate the formation stage of sand waves, exploring how cohesive sediment influences sand wave formation and vice versa (see e.g. Van Oyen & Blondeaux, 2009). Secondly, a (non-linear) idealised model is applied to investigate the decadal evolution of sand extractions and the interaction with benthic organisms and cohesive sediments (see e.g. Damveld et al., 2020). Additionally, we aim to apply numerical bifurcation analysis to both models to allow for the identification of key tipping points and changes in the dynamics within the system.
Results
These models will be applied to unravel the key biogeomorphological processes in response to deep sand extraction, with a particular focus on the coupling between the various system components: how does sediment composition affect sand wave formation and dynamics? What is the impact of deep sand extraction on sea bed morphology and sediment composition? And how does sand extraction impact the spatio-temporal benthic species distribution and the subsequent morphodynamic evolution? As part of the NWO-funded OR-ELSE project, this study also delivers to and contributes from research into other impacts of deep sand extractions, such as impacts on basin-scale flow patterns, habitat-suitability and population dynamics.
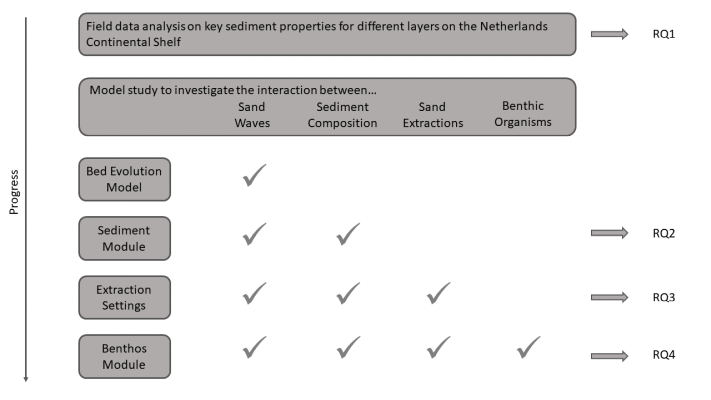
Schematic visualisation of the structure of this study. The first research question addresses data analysis of existing data to explore sediment properties on the NCS. The second to fourth question are modelling steps that expand on one another to explore the interaction between sand waves, sediment composition (RQ2), sand extraction (RQ3) and benthic organisms (RQ4).
References
Damveld, J. H., Borsje, B. W., Roos, P. C., & Hulscher, S. J. M. H. (2020). Biogeomorphology in the marine landscape: Modelling the feedbacks between patches of the polychaete worm Lanice conchilega and tidal sand waves. Earth Surface Processes and Landforms, 45(11), 2572–2587. https://doi.org/10.1002/esp.4914
Deltacommissie. (2008). Samen werken met water: Een land dat leeft, bouwt aan zijn toekomst.
Krabbendam, J. M., Roche, M., Van Lancker, V. R. M., Nnafie, A., Terseleer, N., Degrendele, K., & De Swart, H. E. (2022). Do tidal sand waves always regenerate after dredging? Marine Geology, 451, 1–8. https://doi.org/10.1016/j.margeo.2022.106866
Ministerie van Infrastructuur en Waterstaat, Ministerie van Landbouw. Natuur en Voedselveiligheid, Ministerie van Economische Zaken en Klimaat, & Ministerie van Binnenlandse Zaken en Koninkrijksrelaties. (2022). Programma Noordzee 2022-2027.
Van Oyen, T., & Blondeaux, P. (2009). Tidal sand wave formation: Influence of graded suspended sediment transport. Journal of Geophysical Research: Oceans, 114, C07004, 1–18. https://doi.org/10.1029/2008JC005136
Witbaard, R., & Craeymeersch, J. (2023). Littekens op de zeebodem. Een onderzoek naar de faunistische effecten op lange termijn van diepe zandwinning voor de Nederlandse kust (2023–01; pp. 1–42). Netherlands Institute for Sea Research (NIOZ). https://doi.org/10.25850/nioz/7b.b.8d
Modelling in-situ sand wave dynamics for offshore engineering activities: the role of slope-induced transport
P.H.P. Overes1,2*, B.W. Borsje1 , A.P. Luijendijk2,3, S.J.M.H. Hulscher1
1 University of Twente, Netherlands; 2 Deltares, Netherlands, 3 Delft University of Technology, Netherlands
* Corresponding author: p.h.p.overes@utwente.nl
Introduction
Tidal sand waves are found at the bed of sandy seas throughout the world. These large-scale, dynamic bed forms can grow up to 25% of the water depth and migrate up to tens of meters per year. Their migration and shape deformation can lead to significant bed level changes, which pose a threat to offshore constructions, such as windfarms. To facilitate the major increase in offshore activities, due to among others upscaling of green energy production, predictions of future bed levels on decadal timescales are necessary. Currently, these predictions are often based on historic sand wave dynamics from measurement data. However, these methods are not able to account for extreme events and human interventions and rely on the availability of (historic) data. Using numerical models more understanding of these systems can be gained and more processes can be included in the (uncertainty of) bed level predictions. Two attempts at calibrating a numerical model to reproduce sand wave characteristics (Campmans et al., 2022) and dynamics (Krabbendam et al., 2021), have resulted in unrealistic heights and shape deformation of sand waves respectively. To arrive at more accurate model results, an approach based on system understanding is necessary.
Objective and Methods
The goal of this study is to identify the relevance of morphological parameters and processes for in-situ sand wave dynamics in different environments. To this end, two case study models, with contrasting sand wave characteristics and dynamics, are set up in the Dutch North Sea. The 2DV morphological Delft3D FM model, which is based on Overes et al. (2024), is used to hindcast past sand wave evolution. The hydrodynamics are extracted from the Dutch Continental Shelf Model and include tidal and non-tidal currents in the period between the two measurements. No morphological acceleration is used, which is a first in sand wave modelling. The model is used to test the importance of slope induced transport for sand wave characteristics and dynamics, by varying the related input parameter. The resulting sand wave morphology is compared to the measurements and assessed based on three criteria: height, leading slope and migration rate. Using these criteria more detailed driving mechanisms for sand wave dynamics are revealed. Moreover, the use of the RMSE or BSS in evaluating morphological skill, which are often used for model calibration and favor smooth solutions (Bosboom et al., 2018), is circumvented.
Results
Slope induced transport was found to be an important process for sand wave morphology. When overestimated, this effect can lead to major shape deformations through increased diffusion of sediment. Contrary to the generally accepted slope factor (αbs) of 3, the simulations showed that the use of the default value of 1 resulted in better maintenance of sand wave steepness in both areas, while only leading to limited growth of the sand waves. This sand wave growth manifested through a decrease in trough levels. This may indicate that other processes, such as armouring of the trough, which are often excluded from sand wave models, are limiting the growth. In previous studies the role of slope-induced transport may thus have been overestimated.
In this research, for the first time, in-situ sand wave dynamics are studied based on brute-force hydrodynamics, without morphological upscaling. Combining this more realistic set-up with the multicriteria assessment of morphological results, valuable insights are gained into the exact effects of morphological processes in the field. This in turn allows for a knowledge-based improvement of model set-up. By limiting the importance of slope induced transport, more accurate predictions of in-situ sand wave morphodynamics on multi-year timescales, were achieved.
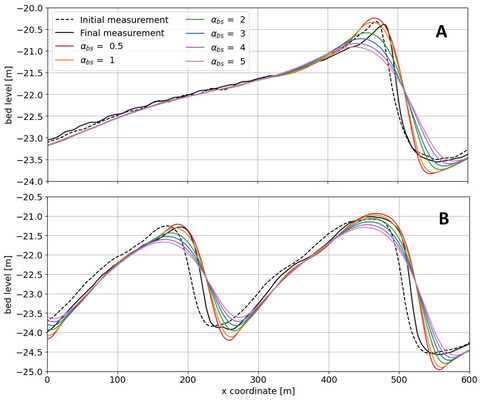
Bed level from measurements and model results with varying importance of slope induced transport at A) a location in the HKZ windfarm zone and B) a location to the west of Texel. A higher bed slope parameter (αbs) indicates larger influence of bed slope induced transport.
References
Bosboom, J., & Reniers, A. (2018). The deceptive simplicity of the Brier skill score. In Handbook of Coastal and Ocean Engineering (pp. 1639-1663). https://doi.org/10.1142/9789813204027_0058
Campmans, G.H.P., van Dijk, T.A.G.P., Roos, P.C., Hulscher, S.J.M.H., 2022. Calibration and validation of two tidal sand wave models: a case study of The Netherlands continental shelf. J. Mar. Sci. Eng. 10 (12), 1902. https://doi.org/10.3390/jmse10121902.
Krabbendam, J.M., Nnafie, A., de Swart, H.E., Borsje, B.W., Perk, L., 2021. Modelling the past and future evolution of tidal sand waves. J. Mar. Sci. Eng. 9 (10), 1071. https://doi.org/10.3390/jmse9101071.
Overes, P. H. P., Borsje, B. W., Luijendijk, A. P., & Hulscher, S. J. M. H. (2024). The importance of time-varying, non-tidal currents in modelling in-situ sand wave dynamics. Coastal Engineering, 104480. https://doi.org/10.1016/j.coastaleng.2024.104480
Understanding Flows and Eddies in the Norwegian Trench
A. Enge1*, J.D. Pietrzak1, F. Mienis2, P. Kraal2, B.C. van Prooijen1
1 Delft University of Technology, Netherlands; 2 NIOZ, Netherlands
* Corresponding author: a.enge@tudelft.nl
Introduction
The Norwegian Trench is a major canyon that cuts through the North Sea off the Norwegian coast. It is well known as the main depositional area of the North Sea. As one of the three major inflow pathways of Atlantic water into the North Sea, the Norwegian Trench plays a key role in the exchange of water masses e.g.Norwegian Coastal Current (NCC) and Atlantic Water (AW) and in the regulation of salinity in the North Sea. Within the trench, mesoscale eddies are observed. These eddies induce high temporal and spatial variability in the exchange processes of the trench. We investigate how these eddies are generated and how they influence sediment resuspension by locally induced high current velocities above the seafloor.
Objective and Methods
We use Copernicus Marine Service (CMEMS) model data and unique Conductivity-Temperature-Density (CTD) observations of the trench taken aboard the research vessel Pelagia between 26 May and 14 June of 2023. The observations are used to validate the model outputs of temperature and salinity. Daily mean model data from 2022 are used to obtain spatial and temporal high reolution information about current velocities and water mass properties. Eddy kinetic energy (EKE) distributions and eddy tracking tools provide the information needed to characterise different energy regimes in the trench and provide insight into erosion hot-spots within a depositional canyon.
Results
From the T-S plots we can see that the model data is capable to represent the discrete observations accurately and in sufficient detail for this study. We see that the strong generation of anticyclonic eddies at 58-59° N correlates with the presence of the topographic ridge that cuts into the trench from east to west. The ridge retroflects the warm, saline AW so that it subducts below the NCC. This can lead to baroclinic instabilities at depths of > 100 m and the generation of anticyclonic subsurface eddies. Cyclonic eddies dominate near the western shelf. The appearance of eddies at the head and mouth of the trench may be due to the influence of canyon dynamics e.g. upwelling and downwelling. The formation of the cyclonic eddies at 61° N could be caused by the southward inflow of AW on the western side of the trench. Preliminary results show that high current velocities are mainly observed at the edges of mesoscale eddies (Fig.1). The mesoscale eddies decay on daily timescales which makes the flow within the Trench highly variable. However, some regions are prone to enhanced bypassing/generation of Eddies and are more likely to experience erosion conditions.
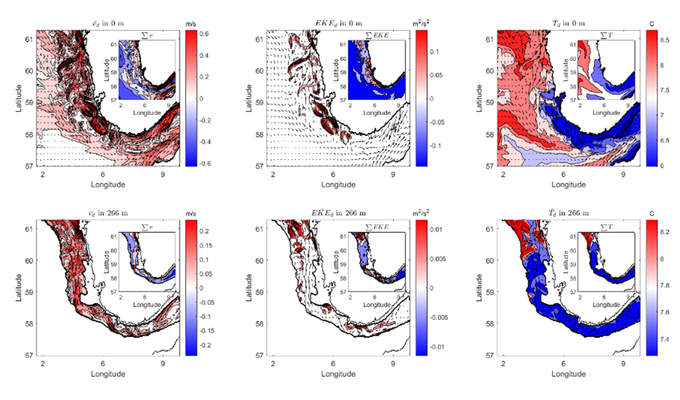
Fig. 1: Daily mean current velocities (v_d), EKE and temperature at the surface and at 266 m depth for a randomly selected day in January 2022. The small plots show the distributions summarized over January 2022. The arrows show the mean current velocity with flow direction.
Effects of shell content on bed mobility under mixed oscillatory and unidirectional flow conditions
J.W. Bosma1, T.J. Kooistra2, S.H. Haarbosch3, T.D. Price1, and M.G. Kleinhans1
1 Utrecht University, the Netherlands; 2 Royal Netherlands Institute for Sea Research, the Netherlands; 3 Delft University of Technology, the Netherlands
* Corresponding author: j.w.bosma@uu.nl
Introduction
Shells and shell fragments exhibit different physical properties from siliciclastic materials, affecting their entrainment and suspension behavior on beaches. This difference can modify a bed’s overall mobility through mechanisms such as ‘hiding and exposure’, where shell particles shade or completely cover the surrounding grains (Miedema and Ramsdell, 2011).
At nourished beach sites, shells are often explicitly incorporated in their designs to reduce erosion rates. Studies on the properties of (individual) shells exposed to flow (e.g., Diedericks et al., 2018) and their impact on bedform formation and migration rates (Cheng et al., 2021) indicate a gravel-like role due to hiding-exposure effects (e.g., McCarron et al., 2019). However, the precise effects of proportions within a sand-shell mixture on the incipient motion and transport rates of the sand have not yet been systematically quantified. Furthermore, most research efforts have only considered steady or accelerating flow in one direction, while oscillatory flow is an inherent aspect of most coastal systems.
By investigating the role of shells in sandy beds for different percentages of shells and under different wave-current conditions, we aim to quantify their effect on bed mobility, characterize armor-layer formation, and develop improved parametrization for coastal morphodynamic models.
Objective and Methods
Under the project name TraSSh (Transport of Sand with Shells), flume experiments have been conducted at the NIOZ Yerseke racetrack-flume facility. The measurement set-up consisted of a 0.6-m wide circular flow channel equipped with a linear-wave generator and a special measurement section with a 2-m long test bed, pressure transducers, current(-profile) meters, side- and top-view cameras, and a bedload trap at the downstream boundary. The test beds were composed of sand-shell mixtures and subjected to physical forcing by both current and waves.
Two series of experiments were done for conditions with waves only, and with waves and current combined. In part 1, the orbital velocities were incrementally increased (with and without a constant background current), which was repeated for five different treatments (0, 5, 10, 20 and 50 vol.% shell content). During the ramp-up phase of each run, the moments of incipient motion according to six predefined transport stages were recorded. In part 2 the focus was on transport rates and armor-layer development. Forcing conditions were kept constant throughout the runs, while bedload and orthophotographs were collected at fixed time intervals to quantify sand transport rates and bed roughness, respectively.
Results
Preliminary findings indicate that initiating sand movement in mixtures containing more than 10 vol.% shell content requires either stronger orbital motions or currents, attributed to the sheltering effects of the shells. Converseley, there is evidence for increased boundary turbulence around shell protrusions at lower shell concentrations (<10 vol.%), which might promote the onset of movement. Furthermore, our bedload measurements demonstrate a clear decrease in transport rates with the addition of shell gravel for two of the three wave-current combinations tested (Fig. 1). Transport rates decreased over time in nearly all cases, including the control runs (i.e. 0 vol.% shells), indicating reduced sand availability regardless of shell content. Interestingly, the runs without an additional current in the direction of wave propagation resulted in larger transport rates. Additional examination of the co-collected orthophotographs should reveal the extent to which the shell material was a modulating factor by forming an armour layer. During the conference, we will methodically present the findings from our oscillatory-flow experiments and discuss their implications for sediment transport and morphodynamic modelling in the nearshore zone.
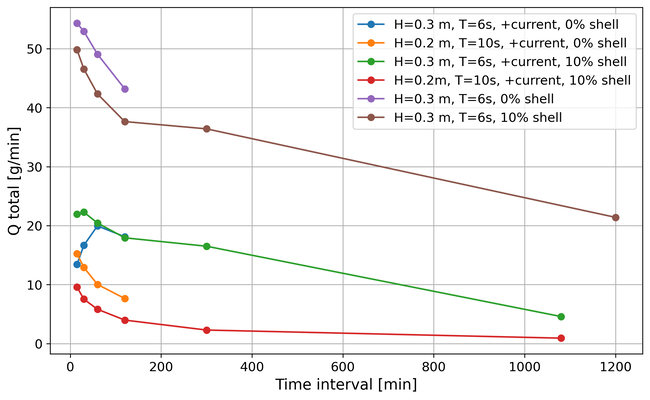
Figure 1. Bedload transport rates of sand (ombinations, where the superimposed current (0.1 m/s) is in the direction of wave propagation.
References
Cheng, C.H., de Smit, J.C., Fivash, G.S., Hulscher, S.J.M.H., Borsje, B.W., Soetaert, K., 2021. Sediment shell-content diminishes current-driven sand ripple development and migration. Earth Surf. Dyn. 9, 1335–1346.
Diedericks, G.P.J., Troch, C.N.A., Smit, G.J.F., 2018. Incipient Motion of Shells and Shell Gravel. J. Hydraul. Eng. 144.
McCarron, C.J., Van Landeghem, K.J.J., Baas, J.H., Amoudry, L.O., Malarkey, J., 2019. The hiding-exposure effect revisited: A method to calculate the mobility of bimodal sediment mixtures. Mar. Geol. 410, 22–31.
Miedema, S.A., Ramsdell, R.C., 2011. Hydraulic transport of sand/shell mixtures in relation with the critical velocity. Terra et Aqua 122.
Linking headland bypassing to the evolution of a spit and beach ridge system - Slocums River Embayment, Buzzards Bay, Massachusetts, USA
Silke Tas1,2*, Zoe Hughes2 , Duncan FitzGerald2, Danghan Xie2, Tansir Zaman Asik2, Sergio Fagherazzi2
1 Wageningen University and Research, the Netherlands; 2 Boston University, USA
* Corresponding author: silke.tas@wur.nl
Introduction
The northwestern Buzzards Bay shoreline in Massachusetts, USA is a complex system consisting of multiple headlands, dividing the coastline into several coastal cells containing tidal inlets and mixed-sediment beaches. While these compartments form (mostly) closed sediment cells during regular wave conditions, high energy events can generate sediment pulses past headlands. As a result, infrequent extreme events, like hurricanes, play a major role in the long-term evolution of this shoreline.
The inlet of Slocums River is situated near the mouth of Buzzards Bay, between the two headlands of Barneys Joy Point and Mishaum Point. The western side of the inlet is characterized by a mixed sand-gravel beach, a sandy spit and a series of beach ridges. Slocums River has been heavily polluted in the past. Although a landfill near Dartmouth, responsible for most of the pollution, has been capped off to prevent polluted run-off into the river (Moraff & United States Environmental Protection Agency, 2019), local communities are worried that further water quality issues may occur as a result of the sediment accumulating near the river inlet. Predicting the future sedimentation around the inlet requires a better understanding of the sources and pathways of sediment transport into Slocums Embayment.
Objective and Methods
This study aims to map pathways and quantify thresholds for headland bypassing around Barneys Joy Point into Slocums River Embayment, using a numerical model (based on Xie et al., in press), and supported by field observations and remote sensing.
Sediment transport in the vicinity of Slocums Embayment is explored using a coupled Delft3D-FLOW/WAVE model. Model boundary conditions are derived from the North Atlantic Coast Comprehensive Study (NACCS), a coastal storm wave and water level modelling study of the US North Atlantic coast (Cialone et al., 2005). Sediment volume changes of the spit at the Slocums River Inlet based on a series LIDAR DEM were used to validate the modelled sediment transport to an order of magnitude.
Results
Slocums Embayment is acting as a sediment sink at the mouth of Buzzards Bay. Based on LIDAR images, the spit near the river inlet is accumulating ca. 2600 m3 sand per year. Under day-to-day conditions, the tidal filling and emptying of Buzzards Bay dominates the current patterns outside of the embayment, and as a result the flow completely bypasses Slocums Embayment. The model results reveal that only under extreme wave conditions (occurring once per year or less) the flow patterns curve around Barneys Joy Point and open a sediment transport pathway into the embayment. The volume of sediment deposited into the
embayment increases with wave height. However, when taking into account the occurrence frequency of the wave conditions, it turns out that the smaller, more frequent extreme wave events (with a return period of one or two years) cumulatively contribute more sediment to the embayment than the most extreme events (return period 10-50 years). While a storm surge can significantly increase the amount of sediment entering Slocums Embayment, the timing between the peak water levels and the peak of the wave conditions can also open a sediment pathway out of the embayment.
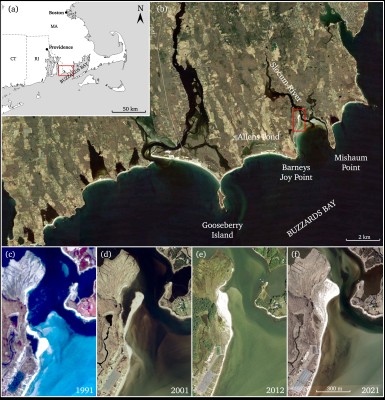
(a) Location of the area of interest in western Buzzards Bay, South Massachusetts, USA. The red rectangle indicates the location of panel b. (b) Slocums Embayment at the mouth of Buzzards Bay, bounded by two headlands: Barneys Joy Point and Mishaum Point. West of Barneys Joy Point is Allens Beach and Allens Pond. The red rectangle indicates the location of panels c-f. (c-f ) Temporal evolution of the spit at Slocums River inlet, in 1991, 2001, 2012 and 2021.
References
Cialone, M. A., Massey, T. C., Anderson, M. E., Grzegorzewski, A. S., Jensen, R. E., Cialone, A., Mark, D. J., Pevey, K. C., Gunkel, B. L., McAlpin, T. O., Nadal-Caraballo, N. C., Melby, J. A., & Ratcliff, J. J. (2005). North Atlantic Coast Comprehensive Study (NACCS) Coastal Storm Model Simulations: Waves and Water Levels (ERDC/CHL TR-15-14, p. 252). U.S. Army Engineer Research and Development Center Coastal and Hydraulics Laboratory.
Moraff, K. & United States Environmental Protection Agency. (2019, October 10). Approval of the Slocums and Little Rivers Embayment System TMDL for Total Nitrogen. https://www.epa.gov/sites/default/files/2019-12/documents/slocums-little-rivers-tmdl-approval-docs.pdf
Xie, D., Hughes, Z., FitzGerald, D., Tas, S., Zaman Asik, T., Fagherazzi, S. (in press). Impacts of Climate Change on Coastal Hydrodynamics Around a Headland and Potential Headland Sediment Bypassing. Geophysical Research Letters, 51, e2023GL105323. https://doi.org/10.1029/2023GL105323
Modelling sand grains exposure to sunlight for sediment tracing in coastal settings
N. Pannozzo1*, S.G. Pearson1, A.-M. de Boer2, T.J. Kooistra3, B.C. Van Prooijen1, J. Wallinga2
1Delft University of Technology, Netherlands; 2Wageningen University & Research, Netherlands; 3Royal Netherlands Institute for Sea Research, Netherlands
* Corresponding author: N.Pannozzo@tudelft.nl
Introduction
Quantifying sediment transport history is crucial for thoroughly understanding coastal systems and accurately designing coastal management interventions (e.g., nourishments). Luminescence, which is the ability of a mineral to store energy when buried and release it again upon exposure to sunlight, can be exploited as a sediment tracing tool in coastal settings, fulfilling the ongoing necessity to track sediment sources and pathways over a broad range of spatial and time scales. By quantifying residual luminescence, it is possible to determine how well-bleached mineral grains were before they were buried, thus yielding information on sediment sources and transport pathways.
Objective and Methods
This study aims to develop a numerical model that quantifies the relationship between residual luminescence of sand grains and their sources and transport pathways in coastal settings, with the ultimate goal of providing a framework to quantitatively infer provenance and transport history of coastal sediments from luminescence measurements. The model derives relationships between suspended sediment concentration (SSC) and light attenuation as a function of water depth to quantify the exposure of a given sand particle to sunlight (Storlazzi et al., 2015) and it couples with the numerical sediment particle tracking model SedTRAILS (Pearson et al., 2021) to compute the cumulative sunlight exposure of such particle (Figure 1). Combined with information on bleaching of luminescence signals as a function of light exposure, this allows to ultimately estimate residual luminescence as a function of sand grains source and transport pathways.
Results
Results from measurements conducted in the Dutch Wadden Sea are used to validate the performance of the model. The employment of the relationships provided by Storlazzi et al. (2015) for the quantification of particle exposure to sunlight is validated using relationships derived from field measurements of SSC and light attenuation across the water column performed within the Ameland Inlet (Figure 1d). The overall performance of the model in estimating cumulative sunlight exposure for a sand particle is then validated through a bleaching experiment performed at the same location. The model will be applied for the first time to investigate the fate of nourished sand in the Ameland Inlet.
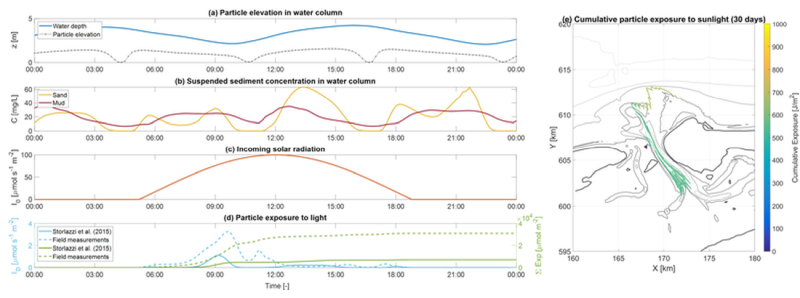
Figure 1. Sand grain exposure to sunlight quantified through relationships between suspended sediment concentration and light attenuation as a function of water depth.
References
Pearson S.G., Elias E.P.L., van Ormondt M., Roelvink F.E., Lambregts P.M., Wang Z. & van Prooijen B. (2021). Lagrangian sediment transport modelling as a tool for investigating coastal connectivity. Coastal Dynamics Conference 2021 Delft University of Technology.
Storlazzi C.D., Norris B.K. & Rosenberger K.J. (2015). The influence of grain size, grain color, and suspended-sediment concentration on light attenuation: Why fine-grained terrestrial sediment is bad for coral reef ecosystems. Coral Reefs, 34 (3), 967-975.
Machine learning for post-storm profile predictions
K. van Asselt1, J.A.A. Antolinez2, P. Athanasiou1, A.J.H.M. Reniers2, R. McCall1, A. Heinlein3
1Deltares, Netherlands 2 TU Delft, Netherlands
koen.vanasselt@deltares.nl
Introduction
Sandy coasts cover about 30% of the world’s coastline and offer several economic and ecological services. Dunes are a typical feature of sandy coasts and offer natural protection from the sea. In extreme storm conditions, the impact of the sea on these dunes results in sediment transport in seaward direction. To be able to guarantee the protection service of dunes and prevent the hinterland from flooding, models are developed to predict sediment transport processes at the dune (dune erosion).
Surrogate models, model of a model, have been developed to reduce computational times of dune erosion calculation. The state of art surrogate models provide a prediction based on a parameterized input and output (Athanasiou et al., 2022 and Gharagozlou et al., 2022). However, a desired surrogate model is able to dealwith spatial input and the prediction of the actual shape of the post-storm sandy profiles.
Objective and Methods
Initially, dune erosion processes and existing surrogate modelling techniques are explored. Through studying
theory on neural networks, U-Net, a CNN architecture developed for image segmentation, is chosen as a suitable convolutional neural network to process 1D pre-storm input profiles and predict 1D post-storm profiles. The potential of using the U-Net architecture is explored with a simplified dataset with known morphological dune response, stationary storm conditions and several performance metric. Through this exploration, the goal is to replicate these dune erosion processes using a surrogate model. The gained insights are used to scale up to a more realistic scenario for the Holland coast.
Parameter sensitivity analyses on the DEV showed that, in general, steeper slopes of submerged profile sections lead to an increase in DEV. Especially the beach- and nearshore slope have a large effect on the modelledDEV
Results
It was found that the network depth, network width and kernel size are crucial hyperparameters for the interpretation of the data by U-Net and the performance of the surrogate model A shallow U-Net architecture is not able to gain an understanding of the processes of dune erosion and attempts to find the statistically optimal solution. In contrast, a deeper and more complex U-Net enables the surrogate model the mimic dune erosion processes and catches a wider range of dune erosion volumes (DEVs). However, it is important to note that due to the lack of alongshore variability in the test data, the improvements resulting from a deeper architecture may not be fully reflected in the performance indicator. In the upscaling phase, the results on a realistic training and test dataset confirm the trends found in the exploration phase of this research. A multi-profile-based training dataset outperforms a single-profile-based
training dataset. Accuracy and skill in post-storm profile shape prediction are obtained through either deeper networks or larger kernel sizes. However, it was found that the current surrogate model has trouble overcoming spatial alterations at the location of erosion processes. .
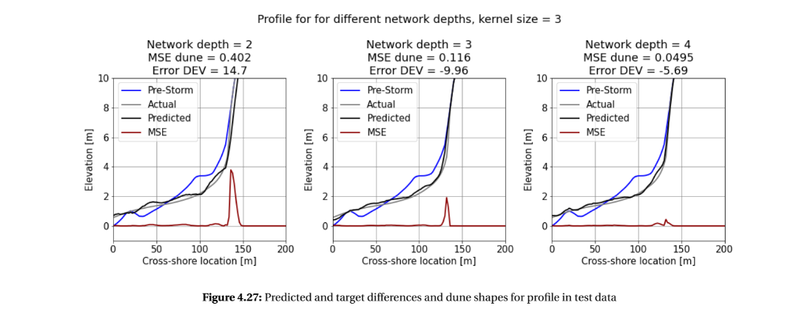
Predicted and target differences and dune shapes for profile in test data
Towards understanding storm-induced sediment losses for a large-scale nourishment strategy at the Belgian Coast
H. Castro Lara1*, B. Roest1,2, A. Dastgheib1,3, W.A. Breugem1, B. Verheyen1, A. Bolle1
1 IMDC, Belgium; 2 KU Leuven, Belgium; 3 IHE-Delft, The Netherlands
* Corresponding author: hilario.castro.lara@imdc.be
Introduction
Low-lying densely-populated areas are vulnerable to the effects of climate change and require long-term strategies for coastal adaptation. The ‘Kustvisie’ project started in 2017 with the goal of achieving a broadly supported, technically-sound and executable ‘Coastal Vision’ for the Belgian Coast, conducting an integrated design study supported by a co-creation process.
During this co-creation process, different long-term coastal protection strategies were assessed. The preferred strategy involves seaward shifts of the coastal profile by means of sand nourishments. These nourishments are likely to interact with the system of tidal gullies and shoreface-connected ridges which is present in front of the Belgian Coast. The MOZES project (Dujardin et al, 2023), currently aims to improve understanding of the interactions between the shoreline and the nearshore seabed on decadal time-scales. These long-term interactions are relevant for future management of the Belgian coast. Understanding these interactions is also important on shorter timescales (i.e. storms).
Objective and Methods
This study aims to gain insight into the effect of the interaction of large seaward profile shifts and tidal gullies on sediment transport and sediment losses during storms. Firstly, the system formed by tidal gullies and shoreface-connected ridges in the Belgian coast is characterized, and the spatial overlap of the seaward nourishment strategy within Kustvisie is determined. Subsequently, a numerical study is performed with XBeach (Roelvink et al, 2008). Here, the response of a cross-shore profile at Raversijde to a T10 storm was assessed in quasi-2D mode. The profile includes the Kleine Rede tidal gully, with bed levels between -6 and -9.5 m TAW and the Stroombank located on its offshore side, with a crest elevation of -3 m TAW.
The model was validated for hydrodynamics by comparing tidal currents to the largely-validated Scaldis-Coast model (Consortium Hoogtij(d) (IMDC, ORG, Arcadis), 2023) . For sediment transport, model validation was not possible and the worst-case scenario in terms of seaward cross-shore sediment transport was sought by cancelling out the wave shape effects contributing to onshore transport (i.e. asymmetry and skewness).
Beside the benchmark scenario, the numerical model has been used to analyse the effect of the presence of a tidal gully and the effect of different nourishment scenarios.
Results
Model results suggest that the presence of a tidal gully leads to slightly increased net offshore sediment transport outside the active zone during storms. Thereafter, sediments are more likely to be transported in the longshore direction due to slightly enhanced tidal currents in the gully. Relative differences shown in this modelling exercise are however limited.
Large seaward profile shifts through nourishments also seem to lead to a slight increase in the offshore-directed net transport during storm conditions. These transports, although already small in absolute numbers, vary from almost none to a small relative increase depending on the nourishment scenario. In addition, model results show that these types of nourishments do not directly impact the longshore transport in the tidal gully, therefore not increasing potential alongshore losses in the seaward strategy.
First estimates on storm-induced sediment transport for seaward nourishments along the Belgian coast in presence of tidal gullies are presented. Although only limited differences are found, it is still highlighted that taking into account the presence of tidal gullies is relevant in maintenance assessments during further research (including a calibrated cross-shore sediment transport model) for the implementation of the seaward strategy.
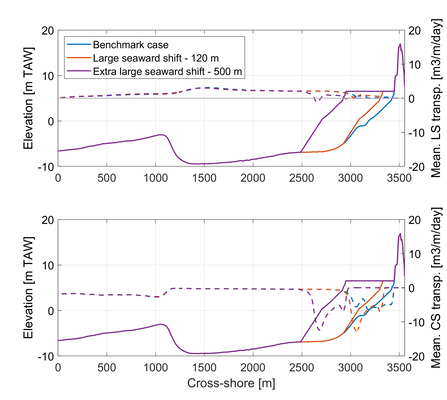
Comparison of benchmark XBeach run (i.e. Original profile, in blue) with two nourishment scenarios: Large 120 m seaward shift (in red) and extra-large 500 m seaward shift (in purple). (Top figure) Estimated mean long-shore transport. (Bottom figure) Estimated mean cross-shore transport.
References
Dujardin, A., Houthuys, R., Nnafie, A., Röbke, B., van der Werf, J., de Swart, H.E., Biernaux, V., De Maerschalck, B., Dan, S., Verwaest, T, (2023). MOZES - Research on the Morphological Interaction between the Sea bottom and the Belgian Coastline. Working year 1. WL Rapporten, Flanders Hydraulics Research, Antwerp, Belgium, 155
Roelvink, D., Reniers, A., van Dongeren, A., van Thiel de Vries, J., McCall, R., Lescinski, J., (2008). Modelling storm impacts on beaches, dunes and barrier islands. Coastal Engineering, Vol 56, 11-12, 1133–1152
Consortium Hoogtij(d) (IMDC, ORG, Arcadis)., (2023). Kustvisie - Referentiesituatie hydromorfologie.
Simulation of cross-shore sandbar migration in a wave-averaged model
H. Shafiei1, J. Chauchat1,2*, C. Bonamy1, P. Marchesiello3
1 University Grenoble Alpes, CNRS, Grenoble INP, LEGI, 38000 Grenoble, France; 2 Institute of Engineering University Grenoble Alpes, France; 3 University of Toulouse, LEGOS (IRD/CNES/CNRS/UPS), Toulouse, France
* Corresponding author: julien.chauchat@univ-grenoble-alpes.fr
Introduction
Morphology of sandy beaches constantly interact with the hydrodynamic forces, creating a highly dynamic environment. One of the most common features of these interactions is the creation and migration of sandbars. The sandbars affect the propagation and breaking of the waves leading to changes in wave non-linearity and set-up. The cross-shore pressure gradient caused by wave setup triggers an offshore-directed current (i.e., undertow) which drives the suspended sediments seaward. On the other hand, wave skewness, asymmetry, and streaming move the near-bed sediments shoreward. Furthermore, the entrainment of the sediments depends of the strength of the shear stress exerted on the sandy bottom by the near-bed flows. Consequently, the contribution of the aforementioned mechanisms to the net sediment transport determines the onshore or offshore migration of the sandbars. This is why sandbar migration can be considered as a proxy to morphological evolution of barred beaches and correctly modelling it is crucial in predicting the hydro-morphodynamics of sandy beaches.
Objective and Methods
Robustly predicting the direction of bar migration has been a challenge for coastal engineers either due to high computational costs (in multiple-phase models) or heavy parametrization (in process-based models). The dependency of the process-based models on calibration parameters limits their ability to simulate both erosive and accretive conditions using the same model settings. In the present work, we progressed a step forward in this challenge by implementing an adapted version of the SANTOSS transport formulations (Van der A et al. 2013) in a wave-averaged 3D model (CROCO) (Shafiei et al. 2023). In this model, the near-bed sand transport is calculated using the SANTOSS formulations and the suspended-load transport (both in and above the wave bottom boundary layer) is resolved by the flow model. Note that the current-driven terms in SANTOSS are deactivated to avoid double-counting. Consequently, the effects of waves and currents are taken into account using separate formulations. This led to successful simulation of both onshore and offshore sandbar migration using the same set of tuning parameters. This model is expected to pave the way for the modelers to predict the morphological evolution of sandy beaches under storm and post-storm conditions in one single run.
Results
The model performance is evaluated and calibrated using the data measured in a two-dimensional wave channel. Sections (a) and (b) of Figure 1 illustrate the reference morphodynamic simulations for erosive (LIP1b) and accretive (LIP1c) conditions respectively. The top panel compares the model results with initial and final measured bathymetry; moreover, the middle and bottom panels show the cross-shore bed-elevation variation and sand-concentration profiles across the channel, respectively. These results are obtained using the bedload coefficient of 0.6 and suspended-load coefficient 0.02 kg.m−2.s−1 (run #22 in Figure 1(e)). Besides, to illustrates the robustness of the model to varying calibration parameters, Figures 1(c) and (d) are presented. They illustrate the cross-shore location of the bar and its respective height evolution in both cases of LIP1b and LIP1c using different values of bedload and suspended-load coefficients. In both cases, the model well predicts the sandbar evolution under a wide range of bedload (e.g., 0.4-1) and suspended-load (e.g., 0.015-0.025 kg.m−2.s−1) coefficients. This would provide a more powerful tool to better predict/assess the long-term (e.g., monthly and seasonal) morphological evolution and the resilience of sandy coasts under varying hydrodynamic conditions.
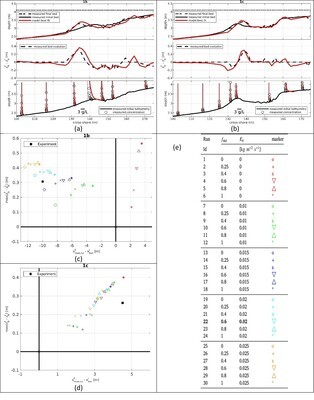
Figure 1: model results. (a)-(b): reference morphodynamic simulations of, respectively, storm and post-storm hydrodynamic conditions using the same model settings. The top panels compare the model final bathymetry with the measured initial and final bed level. The middle panels evaluate the performance of the model to calculate the bed-elevation evolution; the bottom panels illustrate the sediment-concentration profiles at different cross-shore locations. (c)-(d): Distribution of the bar height evolution versus bar migration (between final and initial bed profiles) under different values of bedload and suspended-load coefficients. The corresponding values set for each marker are listed in (e); markers of the same shape and color show the effects of suspended-load and bedload coefficients respectively. Run #22 is the reference case.
References
Van der A, D. A., Ribberink, J. S., van der Werf, J. J., O'Donoghue, T., Buijsrogge, R. H., & Kranenburg, W. M. (2013). Practical sand transport formula for non-breaking waves and currents. Coastal Engineering.
Shafiei, H., Chauchat, J., Bonamy, C., & Marchesiello, P. (2023). Adaptation of the SANTOSS transport formula for 3D nearshore models: Application to cross-shore sandbar migration. Ocean Modelling, 181, 102138.
Influence of intertidal wetlands on salt intrusion: 3D modelling of an engineered estuary environment
R.W.A. Siemes1*, T.M. Duong1,2,3, B.W. Borsje1, S.J.M.H. Hulscher1
1 University of Twente, Netherlands; 2 IHE Delft Institute for Water Education, Netherlands; 2 Deltares, Netherlands
* Corresponding author: r.w.a.siemes@utwente.nl
Introduction
In estuaries, fresh- and saltwater meet. The resulting salt intrusion (SI) processes are of importance for various estuarine functions. Freshwater availability in these regions can be limited during low river flows or storm surges due to which the SI-length temporarily increases. Besides, the stratification (i.e. the vertical difference in salinity) affects estuarine ecosystem functioning and species diversity (Attrill, 2002; Van Diggelen & Montagna, 2016). An increase in stratification also affects sediment dynamics, promoting trapping of sediments in estuaries (Burchard et al., 2018).
In estuaries worldwide, intertidal wetlands are reclaimed for human use (e.g. agriculture). However, they are also increasingly recognised for their various eco-system services, giving rise to wetland restoration projects. This has prompted questions into the influence of intertidal wetlands on salt intrusion (SI) processes. Modelling studies have shown that wetland drowning and wetland reclamation increase the SI-length of the Whidbey Basin and Changjiang Estuary (Yang & Wang, 2015; Lyu & Zhu, 2018). Hendrickx et al. (2023) showed that an increase in intertidal wetland area can place an upper limit on the SI-length. However, there remains a limited process-based understanding of the impact of wetlands on salt intrusion.
Objective and Methods
This work aims to improve our understanding of how changes in wetland geometry affect SI-processes. A schematised 3D hydrodynamic model is developed using the Delft3D-FM software (DFM). Model conditions are based on the Rotterdam Waterway, the Netherlands, representing a highly engineered estuary with SI processes reflecting a partially mixed to a salt-wedge regime, depending on temporal hydrodynamic conditions.
The model is validated for present-day conditions, after which various scenarios are implemented, representing changes in 1) intertidal wetland width, i.e. wetland reclamation or restoration, 2) relative SLR in the wetland and 3) channel depth of the estuary, as channels are deepened worldwide to improve port navigability, which alters the dominant SI-processes. For these scenarios, a constant low river discharge and a constant tidal signal (M2 + M4 + M6) are used.
The modelled salt transport is decomposed into 3 components following Garcia et al. (2021), to improve process-based understanding. The components represent 1) the salt flux related to the residual flow (Fres), the depth-averaged and tide-averaged component, 2) the salt flux related to the estuarine circulation (Fcirc), which is the depth-varying and tide-averaged component and 3) the salt flux related to the tidal oscillation (Ftide), which includes all tide-varying components.
Results
Generally, salt transport into the estuary comes from Fcirc and Ftide, while salt export out of the estuary is attributed to Fres. An increase in wetland width and relative sea level rise (SLR) in the wetland increases the tidal prism of estuaries, thereby enhancing the tidal flow. Consequently, this results in a suppression of the stratification in the estuary (Figure c), weakening the estuarine circulation flow.
Widening of the wetland and relative SLR in the wetland consistently reduce Fcirc and increase Ftide. In strongly stratified estuaries, the reduction in Fcirc outweighs the increase in Ftide, resulting in a decrease in salt transport into the estuary and subsequently a slight reduction in the SI-length. When the estuary is more mixed, the contribution of Fcirc becomes negligible and the increase in Ftide is dominant. In such a system, the increase in tidal prism enhances salt import into the estuary, consequently leading to a small increase in the SI-length (Figure a).
As such, results highlight that intertidal wetland geometry can play a minor role in changing the SI-length (Figure a). However, wetlands play a substantial role in the system's degree of stratification (Figure c), relevant for ecological functioning and sedmiment trapping in estuaries.
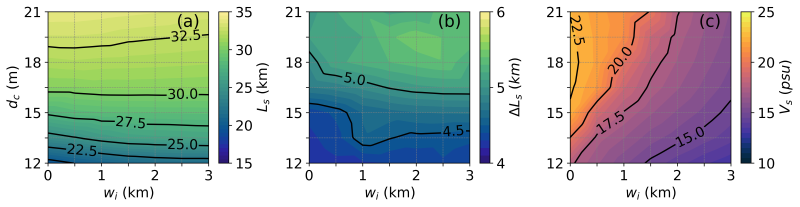
The impact of channel depth (dc) and intertidal wetland width (wi) on the salt intrusion length (Ls, a), the variation in salt intrusion length over a tidal cycle (ΔLs, b) and the stratification in the inlet of the estuary (Vs, c), during a low discharge event.
References
Attrill, M. J. (2002). A testable linear model for diversity trends in estuaries. Journal of Animal Ecology, 71 (2), 262-269. doi: https://doi.org/10.1046/j.1365-2656.2002.00593
Van Diggelen, A. D., & Montagna, P. A. (2016). Is salinity variability a benthic disturbance in estuaries? Estuaries and Coasts, 39 , 967–980. doi: 10.1007/s12237-015-0058-9
Burchard, H., Schuttelaars, H. M., & Ralston, D. K. (2018). Sediment trapping in estuaries. Annual Review of Marine Science, 10 (1), 371-395. doi: 10.1146/annurev-marine-010816-060535
Yang, Z., & Wang, T. (2015). Responses of estuarine circulation and salinity to the loss of intertidal flats – a modeling study. Continental Shelf Research, 111, 159-173. https://doi.org/10.1016/j.csr.2015.08.011
Lyu, H., & Zhu, J. (2018). Impacts of Tidal Flat Reclamation on Saltwater Intrusion and Freshwater Resources in the Changjiang Estuary. Journal of Coastal Research, 35 (2), 314-321. doi: 10.2112/JCOASTRES-D-18-00077.1
Hendrickx, G. G., Kranenburg, W. M., Antol ́ınez, J. A., Huismans, Y., Aarninkhof, S. G., & Herman, P. M. (2023). Sensitivity of salt intrusion to estuary-scale changes: A systematic modelling study towards nature-based mitigation measures. Estuarine, Coastal and Shelf Science, 295 , 108564. doi:https://doi.org/10.1016/j.ecss.2023.108564
Garcia, A. M. P., Geyer, W. R., & Randall, N. (2021). Exchange flows in tributary creeks enhance dispersion by tidal trapping. Estuaries and Coasts, 1–19. doi: https://doi.org/10.1007/s12237-021-00969-4
Influence of lateral estuarine bathymetry on salt intrusion in single-channel systems and channel junctions
Hendrik Jongbloed1,2, Henk M. Schuttelaars2, Yoeri M. Dijkstra2, Antonius J.F. Hoitink1
1Hydrology and Environmental Hydraulics, Wageningen University and Research, Wageningen, The Netherlands; 2Delft Institute of Applied Mathematics, Delft University of Technology, Delft, The Netherlands
henk.jongbloed@wur.nl
Introduction
Estuarine channel depth is known to be one of the most important factors controlling salt intrusion. To parametrically understand its influence, idealized width-averaged (2DV) or along-channel (1D) approaches (e.g. Hansen and Rattray (1965)) are often employed. This type of exploratory model necessarily requires a measure of effective water depth as input. However, an estuarine bathymetry often varies considerably throughout the estuary, causing intrinsically three-dimensional transport mechanisms that potentially influence salt dispersion to a large degree. These significant correlations cannot be straightforwardly translated to 2DV and 1D models, instead, they must be parametrized.
Objective and Methods
In this work, we attempt to capture and parametrize the influence of lateral bathymetric variations on longitudinal salt transport processes, suitable for direct application in existing 2DV and 1D frameworks. We present a three-dimensional subtidal model for water motion and salinity in partially stratified estuaries, extending the width-averaged approaches of Hansen & Rattray (1965) and MacCready (2004) to general 3D geometries. This model allows for semi-analytically investigating the net effect of lateral bathymetric variations on salt transport mechanisms and salt intrusion, leading to an effective depth parametrization that follows directly from the analysis of the transport equations.
Results
As a first result, we demonstrate that in single channel systems, lateral depth variations may directly cause a twofold increase in salt intrusion, keeping other parameters (i.e. cross-sectional area) unchanged. Secondly, we quantify the influence of bed variations at tidal channel junctions on salt fluxes across the junction branches, however, an analysis of salt transport terms at channel junctions is yet to be done.
![Cross-sectional view of an estuary with a Gaussian lateral bathymetry. Top to bottom: Salinity [psu], along-channel and cross-channel flow [m/s].](/content/images/boa2024/249/reg2-0125ls.png)
Cross-sectional view of an estuary with a Gaussian lateral bathymetry. Top to bottom: Salinity [psu], along-channel and cross-channel flow [m/s].
References
Hansen, D. V., & Rattray, M. (1965). Gravitational circulation in straits and estuaries. Journal of Marine Research, 23(2), 104–122.
MacCready, P. (2004). Toward a unified theory of tidally-averaged estuarine salinity structure. Estuaries, 27(4), 561–570. https://doi.org/10.1007/BF02907644
The impact of morphological evolution on hydrodynamics and sediment redistribution of the Western Scheldt estuary from 1200-2020
J. Mi1,2*, T. Gerkema1 , P.W.J.M. Willemsen3,4, J. van der Molen1, J. van de Koppel1,5, M. van de Wegen4,6, T.J. Bouma1,2
1 NIOZ Royal Netherlands Institute for Sea Research, the Netherlands; 2 Utrecht University, the Netherlands; 3 University of Twente, the Netherlands; 4 Deltares, the Netherlands; 5 University of Groningen, the Netherlands; 6 IHE Delft, the Netherlands
* Corresponding author: jie.mi@nioz.nl
Introduction
The Western Scheldt, like many estuaries, faces transitions from natural evolution to artificial adjustments by human interventions. Since the Middle Ages, the latter has caused significant morphodynamic changes; especially continuous land reclamation works and the repeated deepening of navigation channels, remain noticeable today. In the face of present and future sea level rise, there is not only the risk of coastal flooding, but also the possibility of changes in the tidal regime. In this study, we aim to explore the connectivity of historical estuaries, by assessing i) how the morphological changes over time have changed the tidal characteristics, and hence sediment transport; and, ii) the sensitivity of prevailing water levels to dominant wind directions/surges.
Objective and Methods
This study compiles diverse sources of historical geographic and navigation maps, and contemporary measurement data, providing reliable bathymetries for reconstructing tide deformation in ancient configurations of the Western Scheldt. 3D high-resolution numerical simulations will be carried out using the General Estuarine Transport Model (GETM) to simulate the hydrodynamics in the Western Scheldt for each snapshot. We will use the Framework for Aquatic Biological Modeling (FABM) for suspended particulate matter transport, coupled with GETM, which solves the advection-diffusion equation for the total sediment load. By comparing modeled tidal amplitudes with increases in historical dike crest elevations, we attempt to validate the model.
Results
We aim to assess the hypothesized changes by model setup: With the construction of dikes and land reclamation works, the tidal amplitude has likely amplified. Specifically, changes in the asymmetry of the tides will result in changes in the import or export of sediment. In addition, we shall consider the connectivity of historical estuaries and their impact on the freshwater distribution, and on estuarine circulation and sediment transport.
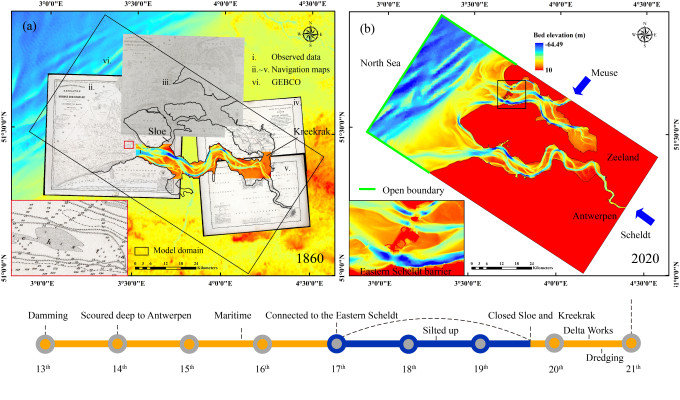
Figure 1. Timeline of Western Scheldt and: (a) Maps of 1860, integrate with navigation maps, measured data, and General Bathymetric Chart of the Oceans (GEBCO); (b) Grid of GETM, 2020.
The influence of lateral dynamics on the sediment dynamics in tidally dominated estuaries
M.P. Rozendaal1*, Y.M. Dijkstra1 , H.M. Schuttelaars1
1Delft Institute of Applied Mathematics, Delft University of Technology, The Netherlands;
*Corresponding author: M.P.Rozendaal@tudelft.nl
Introduction
The complex bathymetry and geometry of estuaries greatly affects the water motion and suspended sediment dynamics. The complex structure of the lateral bathymetry induces complex three-dimensional flows, that, in turn, drive complex three-dimensional sediment motion. Sediment tends to accumulate in the regions where the transport of sediment converges (Kumar, 2018). If the convergence is strong enough, a region may be formed where the levels of suspended sediment are highly elevated: an Estuarine Turbidity Maximum (ETM). Even though much attention has been given to the formation and dynamics of ETMs (see, e.g., Huijts, 2006), the influence of lateral bathymetry and dynamics on the formation of ETMs remains poorly understood. To improve our understanding, an idealized modeling approach is taken, where only the essential processes are taken into account. This allows us to gain fundamental insights into the physical processes governing sediment dynamics. Moreover, the idealized approach allows us to build a highly specialized model which is fast such that extensive parameter sensitivity studies can be performed.
Objective and Methods
To study the lateral dynamics, iFlow3D is constructed, which is a three-dimensional idealised hydro and sediment dynamic model. This model can effectively handle highly realistic and complex geometries and bathymetries. Using Fourier analysis, the harmonic components of the water motion and suspended sediment concentration can be directly identified and computed, e.g., M0, M2, M4 etc., without the need for time stepping methods and spin up time. Using these harmonic components, individual transport processes can be identified and the net sediment transport can be computed. Using the concept of morphodynamic equilibrium, a dynamic equilibrium distribution of sediments can be determined and ETMs identified. The resulting model is fast enough such that parameter sensitivity studies can be performed and the parameter space explored.
Results
We consider the sensitivity of the sediment transport and the lateral sediment distribution to changes in the lateral bathymetric profile. We explore several bathymetric shapes from a rectangular profile to a Gaussian profile with pronounced channels and shallow areas, and we investigate the effects of width convergence. The general trends of the sediment distribution will be explained in terms of the underlying flow and transport processes.
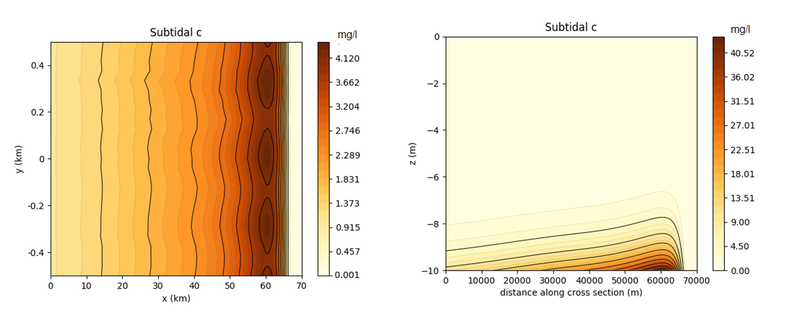
Fig 1. Preliminary results of the subtidal Suspended Sediment Concentration (SSC) in a rectangular estuary with a flat bed and prescribed salinity field. Here, x is the longitudinal coordinate, y the lateral coordinate and z the vertical coordinate. Left, top view of the depth-averaged SSC and right, a longitudinal cross-section of the SSC at y=0.
References
K. M. Huijts, H. M. Schuttelaars, H. E. de Swart, and A. Valle-Levinson. Lateral entrapment of sediment in tidal estuaries: An idealized model study. Journal of Geophysical Research: Oceans, 111(12):1–14, 2006. doi:10.1029/2006JC003615.
M. Kumar. Three-Dimensional Model For Estuarine Turbidity Maxima In Tidally Dominated Estuaries. PhD thesis, Delft University of Technology, 2018.
Improving certainty in ADCP suspended sediment monitoring using multiple frequencies
R.A.J. Jaarsma1,2*, M. Daugharty1, S.D. Kamminga1, M.A. van der Lugt2,3, M.A. de Schipper2, B.C. van Prooijen2
1 Nortek Netherlands B.V., The Netherlands; 2 Delft University of Technology, The Netherlands; 3 Deltares, The Netherlands
* Corresponding author: ruurd.jaarsma@nortekgroup.com
Introduction
Monitoring of suspended sediment concentration (SSC) is crucial in coastal management: calibration and validation of numerical sediment transport models, turbidity monitoring during dredging activities, and tracking sediment budgets over time are a few related activities. Direct monitoring methods rely on water sampling which are labour intensive and costly. Indirect monitoring methods are based on laser diffraction and optical (OBS) or acoustic (ABS) backscatter measurements. ABS recorded by Acoustic Doppler Current Profilers (ADCP) shows great potential due to the ability of combining with flow measurements, allowing estimates of sediment flux with a single instrument.
As with instruments using OBS, certainty of ADCP SSC predictions depends on the use of appropriate relations between backscatter and SSC. The theoretical relation between SSC and backscatter is sensitive to sediment properties such as particle size. Therefore, frequent checks of sediment properties in the water column are necessary, which often involves extensive water sampling (Plancke et al. 2017). There are methods to reduce the sensitivity of the appropriate relation between backscatter and SSC, based on multi-frequency backscatter response. Although showing promising potential, up until now their application has been limited by alignment issues induced by using separate instruments (Guerrero et al., 2013; Jourdin et al., 2014).
Objective and Methods
To overcome these alignment limitations, a Nortek Signature1000 ADCP was adapted to record near simultaneous, multi-frequency backscatter profiles using its high-resolution, vertical echosounder transducer. Whether certainty in ADCP SSC predictions can be increased using this instrument was assessed based on a field campaign in the Molengat tidal channel near Texel Island, The Netherlands (Figure 1a) in Spring 2022. Using a small boat, backscatter was recorded at 1000, 500 and 250 kHz under varying flow conditions while simultaneously acquiring water samples using a Niskin bottle sampler. The multi-frequency processing method – where estimates of mean particle radius are derived based on particle size-acoustic wavelength interactions (Thorne & Meral, 2008) – was applied based on the 1000 and 500 kHz signal and after including these particle radius estimates in an adapted backscatter-SSC relation, compared with the more traditional single frequency approach.
Results
Based on correlations of the SSC deduced from backscatter and Niskin bottle sampled SSC, performance of the single frequency approach was found to be reasonable for measurements taken during a single ebb tidal phase. Applying this traditional ADCP backscatter method to a combined set of ebb and flood measurements led to poor results due to strong variations in observed backscatter intensity (Figure 1c), presumably induced by variations in particle properties over the tidal cycle. In the multi-frequency approach, correlations improved significantly, and ebb and flood measurement samples were both predicted well (Figure 1d).
Follow-up work should include an analysis of the water sample’s particle diameter to confidently attribute the improved performance of the multi-frequency method to changing particle properties and should assess a larger sample size. This application of the multi-frequency approach using the vertical echosounder transducer on the Nortek Signature1000 ADCP shows the potential for improved SSC estimates from sailing ADCP monitoring. Combined with profiles of current velocity and direction, there is the ability to monitor suspended sediment fluxes all in one single instrument.
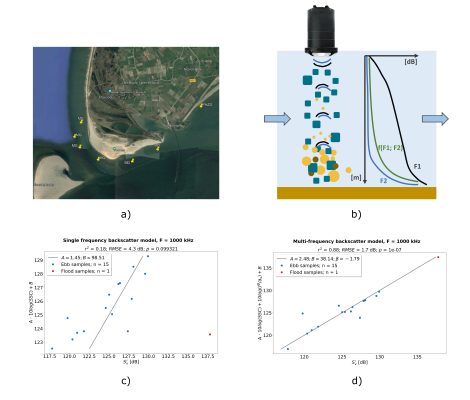
Figure 1: a) Field measurements were taken in and around the Molengat tidal channel near Texel Island in Spring 2022. b) Based on particle size-acoustic wavelength interactions, the backscatter response varies with particle size between frequencies. Combining empirical backscatter responses with multi-frequency measurements yields mean particle radius estimates, which can be applied to establish a more robust relation between backscatter and SSC. c), d) Performance differences of the single and multi-frequency approach for a combined ebb and flood measurement set.
References
Guerrero, M., Szupiany, R. N., & Latosinski, F. (2013). Multi-frequency acoustics for suspended sediment studies: An application in the Parana River. Journal of Hydraulic Research, 51(6), 696–707. https://doi.org/10.1080/00221686.2013.849296
Jaarsma, R. A. J. (2023). Quantifying suspended sediment using multi-frequency echosounder measurements [Delft University of Technology]. https://repository.tudelft.nl/islandora/object/uuid%3A82cfb0e6-863a-4f85-a8bc-7c5e16c69b05
Jourdin, F., Tessier, C., Le Hir, P., Verney, R., Lunven, M., Loyer, S., Lusven, A., Filipot, J.-F., & Lepesqueur, J. (2014). Dual-frequency ADCPs measuring turbidity. Geo-Marine Letters. https://doi.org/10.1007/s00367-014-0366-2
Plancke, Y. M. G., Vandebroek, E., Claeys, S., & Meire, D. (2017). Sediment transport in the Schelde-estuary: The challenge of performing good measurements in challenging conditions. Hydraulic Measurements and Experimental Methods 2017 Conference (HMEM 2017.
Thorne, P. D., & Meral, R. (2008). Formulations for the scattering properties of suspended sandy sediments for use in the application of acoustics to sediment transport processes. Continental Shelf Research, 28(2), 309–317. https://doi.org/10.1016/j.csr.2007.08.002
Anthropogenic and climate forcing cause major changes in the GBM delta morphology in the 21st century
Johan Reyns1,2, Mick van der Wegen1,2, Dano Roelvink1,2
1 IHE Delft. the Netherlands; 2Deltares, the Netherlands
* Corresponding author: j.reyns@un-ihe.org
Introduction
Among the world’s largest delta systems, the Ganges-Brahmaputra-Meghna (GBM) delta is an extremely complex channel system that experiences high rates of relative sea level rise (Becker et al, 2020), and ever increasing anthropogenic interventions (Paszkowski et al., 2021). Therefore, in the framework of sustainable delta management, assessment of the impacts of these disturbances on the hydrodynamics and sediment dynamics, at present and in the future under climate change and further human interventions is essential. Here, we present sediment budgets of the Bengal part of the GBM delta, including incoming sediment volumes, transport and distribution in the river system and the estuaries. Moreover, analysis of the multi-decadal morphodynamics, to get a comprehensive understanding on how the system functions as a whole, and to estimate the morphological impact of climate change and anthropogenic works at the delta scale.
Objective and Methods
With the aim of understanding these long-term and large-scale morphodynamics of the Ganges-Brahmaputra-Meghna (GBM) delta, we set up a 2DH large-scale coastal model using Delft3D FM (Kernkamp et al., 2011). This model has been developed to simulate hydrodynamics, sediment transport, and morphological change on the delta-scale, and the validation results for tidal propagation, discharges and bed level change compared favourably with observations over a 25-year period. Subsequently, we carried out scenario simulations over 80 years, until 2100, to investigate the effects of sea level rise, land subsidence, upstream discharge regime and the effects of a lower future upstream sediment concentration, mimicking the effect of sediment entrapment by dam building.
Results
Under current conditions, approximately 1/3th of the fluvial sediment input is exported to the deep sea, and the other 2/3th is deposited in the delta area, mainly through the eastern branches of the Lower Meghna estuary, making the system sediment-supply dominated. Changes of the sediment dynamics in the GBM delta are mainly influenced by the changes in the river flow regime and the sediment transport regime at the upstream river reaches. Under sea level rise (SLR) conditions, we see a general trend of sedimentation in the tidally influenced part of the delta, however an order of magnitude less than the sea level rise itself, with a tendency for net land loss after 2050. This effect is exacerbated by land subsidence, such that a SLR of 0.5 m by 2100 combined with subsidence approximately has the same effect as a SLR of 1m. Climate change is expected to lead to increased Ganges and Brahmaputra discharges. This increase will result in higher sedimentation in the Lower Meghna. Considering anthropogenic effects, we expect a strong reduction in sedimentation in the lower estuarine reaches and the delta front, with strong land loss after 2050.
References
Becker, M., Papa, F., Karpytchev, M., Delebecque, C., Krien, Y., Khan, J. U., ... & Shum, C. K. (2020). Water level changes, subsidence, and sea level rise in the Ganges–Brahmaputra–Meghna delta. Proceedings of the National Academy of Sciences, 117(4), 1867-1876.
Kernkamp, H. W., Van Dam, A., Stelling, G. S., & de Goede, E. D. (2011). Efficient scheme for the shallow water equations on unstructured grids with application to the Continental Shelf. Ocean Dynamics, 61, 1175-1188.
Paszkowski, A., Goodbred Jr, S., Borgomeo, E., Khan, M. S. A., & Hall, J. W. (2021). Geomorphic change in the Ganges–Brahmaputra–Meghna delta. Nature Reviews Earth & Environment, 2(11), 763-780.
Evaluating the impact of natural and anthropogenic factors on fine sediment dynamics in the Wadden Sea based on hydrodynamic and suspended sediment observations near Holwerd and Ferwerd
Q. Bi1* and T. van Kessel1
1 Marine and Coastal Systems, Deltares, The Netherlands
* Corresponding author: qilong.bi@deltares.nl
Introduction
Sediment dynamics in the Wadden Sea are steered by a complex interplay of natural processes, but may also be influenced by human activities (Elias et al. 2012; Vonhögen-Peeters et al., 2013). In July 2022, a long-term monitoring campaign was launched to collect comprehensive data on turbidity, tidal currents, wind, waves, and salinity in the tidal channels near Holwerd and Ferwerd. By comparing an undisturbed system at Ferwerd with a human-impacted system with intensive shipping and dredging at Holwerd, we aim to identify and quantify the influences of multiple natural forcings and human activities on the local sediment dynamics. The goal of this data analysis is to deepen our insight into the suspended sediment dynamics within the system, providing a clearer picture of contributions of both natural and anthropogenic factors.
Objective and Methods
The initial analysis of these datasets involves several steps. The first step is a check on the data quality and usability. The next step is to apply various techniques, such as seasonality analysis and multivariate analysis, to explore the relationships among the measured parameters and inspect the importance of natural and human factors on the turbidity at different time scales. Furthermore, by combining data on ferry operations and maintenance dredging in the Holwerd channel and comparing the findings from two locations, their distinct environmental features are uncovered.
Results
The analysis shows that at both locations, short-term variations in the suspended sediment concentrations (SSC) are strongly controlled by variations of the local flow velocity and wave height. In the longer term, SSC also show seasonal changes (higher in winter and lower in summer, see Figure 1), which can only be partly explained by seasonal variations in physical forcing (notably wind and waves, salinity, and temperature). For similar physical conditions, the relation between bed shear stress and SSC is different in summer than in winter. This may be explained by variations in the availability and properties of fine sediments, suggesting the influence of biological activity and variations in mudflat stability. Furthermore, the comparison reveals that the SSC at Ferwerd is slightly lower in summer and higher in winter than that at Holwerd. At Ferwerd the channel is deeper and there is no local human disturbance. Seasonal dynamics are more pronounced, suggesting a greater variation in the supply and properties of sediments and a greater influence of organic material. Finally, the impact of the ferry and dredging on SSC levels at Holwerd is not evident from the data. Although occasional matches between peak SSC and human activities are observed, the correlation is not statistically significant. The mean of the measured SSC is approximately the same during periods with and without disturbance. However, this impact may still occur on a longer time scale, and might then result in a general increase in the background concentration. This requires further research on longer data sets as monitoring at Holwerd and Ferwerd continues in 2024.
In conclusion, the proposed methodology for analyzing long-term measurement data at Holwerd and Ferwerd is demonstrated effective. Insights are gained by evaluating both natural and anthropogenic factors at the two sites, but limitations of the current dataset are also noticed, which highlight the need for continuing and improving the monitoring. Because of the identified importance of variations in sediment properties and availability, it is recommended to make additional measurements on suspended particle properties such as size, settling speed and organic composition, and to add a second measuring frame on the nearby tidal flats to better distinguish between horizontal and vertical transport processes. As observations continue this year, this analysis will be further extended.
Acknowledgement: we thank Rijkswaterstaat (RWS) for their financial support, data provision, and review of this study.
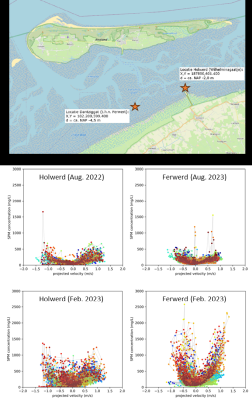
Figure 1. Monitoring locations and SPM concentration against velocity at Holwerd and at Ferwerd in August 2022 and in February 2023.
References
Elias, E., Spek, A., Wang, Z., & Ronde, J. (2012). Morphodynamic development and sediment budget of the Dutch Wadden Sea over the last century. Netherlands Journal of Geosciences - Geologie en Mijnbouw, 91, 293 - 310.
Vonhögen-Peeters, L. M., van Heteren, S., Wiersma, A. P., de Kleine, M. P., & Marges, V. C. (2013). Quantifying sediment dynamics within the Dutch Wadden Sea using bathymetric monitoring series. Journal of Coastal Research, (65), 1611-1616.
Roles of sand, silt, and clay in the morphodynamics of mixed sediment environments
P.S. Miranda1,2*, J.J. van der Werf1,2 , S.J.M.H. Hulscher1
1 University of Twente; 2 Deltares
* Corresponding author: p.s.miranda@utwente.nl
Introduction
Our research is under the framework of Marie Sklodowska-Curie Action Doctoral Network programme funded by the EU entitled, SEDIMARE. Specifically, our research focuses on practical morphological modeling of sand-mud mixtures.
Estuaries are systems that provide value to both ecology and human activities. However, estuaries are also susceptible to degradation from both sea level rise, and storms. One way to help preserve these systems is by understanding their morphodynamics.
The current studies on estuarine morphodynamics have mostly been towards mixed sediment systems that are sand- or clay-dominated (van der Wegen & Roelvink, 2012; Vanlede et al., 2019). However, there are estuaries which are silt-dominated that are not yet fully understood (te Slaa, 2020).
My PhD will describe the explicit contribution from each sediment component by adapting the erosion behavior and bulk density formulas. These will be validated by incorporating them into the process-based model, Delft 3D, and analyzing the resulting morphdynamics. Validation cases will be chosen depending on what sediment component is dominant (e.g. sand, silt, or clay). Finally, these systems will be subjected to long-term modeling with sea level rise, and short-term modeling with storm forcing. This is to assess the potential impact of these forcings on the morphodynamics of different types of estuaries.
Objective and Methods
The methodology will involve an analysis of the current erosion models (Chen et al., 2018; Van Ledden et al., 2004; van Rijn, 2007; Wu et al., 2018) for mixed sediments. From these models, together with available data,
Nand will be incorporated into the process-based numerical model, Delft 3D 4. These, such as the Western Scheldt (sand-dominated) and Yangtze river (silt-dominated) estuaries, and Zeebrugge harbor (clay-dominated).
Finally, numerical test cases will be done to understand the effect of sea level rise and storm conditions on the differently dominated sediment systems. We will apply the appropriate Intergovernmental Panel on Climate Change (IPCC) Shared Socioeconomic Pathways (SSP) for decadal lengths on each of the systems and then analyzing the resulting morphodynamics. Similarly, historically significant storms for each of systems will be introduced as hydrodynamic forcing in the numerical model. The immediate (timescale: hours) and short-term (timescale: days to months) impact of the storm to the morphodynamics will be analyzed.
Results
Expected result is a new formulation for erosion behavior and bulk density of mixed sediments with explicit contributions from each sediment classification. We also expect morphodynamic results in good agreement with measured bathymetry of differently dominated sediment systems. Finally, we expect to gain insight into the effects sea level rise and storm conditions have on different types of estuaries
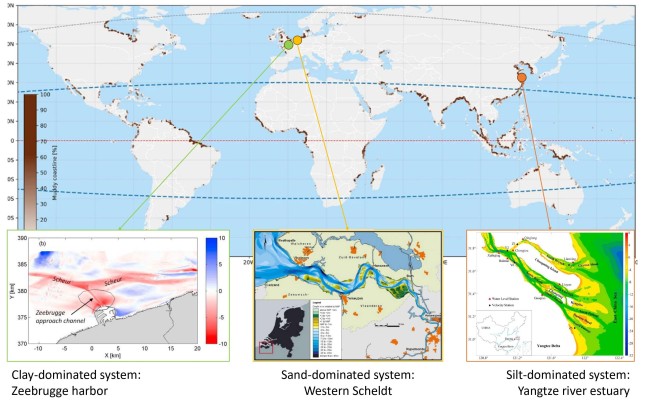
Maps of estuaries from van Maren et al. (2020) for Zeebrugge harbor, Bolle et al. (2010) for the Western Scheldt, and Feng et al. (2020) for the Yangtze river estuary overlain on muddy coasts of the world from Hulskamp et al. (2023)
References
Bolle, A., et al. (2010). The influence of changes in tidal asymmetry on residual sediment transport in the Western Scheldt. Continental Shelf Research, 30(8), 871–882.
Feng, H., et al. (2020). Effects of recent morphological change on the redistribution of flow discharge in the Yangtze River Delta. Continental Shelf Research, 208.
Hulskamp, R., et al. (2023). Global distribution and dynamics of muddy coasts. Nature Communications, 14(1), 8259.
te Slaa, S. (2020). Deposition and erosion of silt-rich sediment-water mixtures [Doctoral thesis, Delft University of Technology].
van der Wegen, M., & Roelvink, J. A. (2012). Reproduction of estuarine bathymetry by means of a process-based model: Western Scheldt case study, the Netherlands. Geomorphology, 179, 152–167.
Van Ledden, M., et al. (2004). A conceptual framework for the erosion behaviour of sand-mud mixtures. Continental Shelf Research, 24(1), 1–11.
van Maren, D. S., et al. (2020). Formation of the Zeebrugge coastal turbidity maximum: The role of uncertainty in near-bed exchange processes. Marine Geology, 425.
van Rijn, L. C. (2007). Unified View of Sediment Transport by Currents and Waves. I: Initiation of Motion, Bed Roughness, and Bed-Load Transport. Journal of Hydraulic Engineering, 133(6), 649–667.
Vanlede, J., et al. (2019). Mud dynamics in the Port of Zeebrugge. Ocean Dynamics, 69(9), 1085–1099.
Response time of global deltas to river sediment supply change
J. Wang1,2*, J.H. Nienhuis1 , Z.J. Dai2,3
1 Department of Physical Geography, Faculty of Geosciences, Utrecht University, Utrecht, the Netherlands; 2 State Key Laboratory of Estuarine and Coastal Research, East China Normal University, Shanghai, China; 3 Laboratory for Marine Geology, Qingdao National Laboratory for Marine Science and Technology, Qingdao, China
* Corresponding author: j.wang7@uu.nl
Introduction
River deltas are among the most dynamic and biologically productive regions on Earth’s surface. However, many deltas face declining river sediment supply. There is a theoretical expectation that this decline will reduce delta land growth, or cause delta land loss, but delta-scale field verification has so far remained incomplete. This may be because of large time delays between river sediment supply fluctuations and delta response.
Objective and Methods
Here, our primary objectives are: (1) to quantify changes in suspended sediment discharge and land area in 94 major river deltas worldwide since 1984; (2) to analyze the gains and losses of deltaic tidal wetlands (mangroves, salt marshes, and bare flats) and their transition patterns; (3) to compare the differences in morphodynamics and time lags between river-, tide-, and wave-dominated deltas. The main methods include: (1) obtaining fluvial sediment supply timeseries to deltas; (2) extracting delta land area and tidal wetland changes from Global Surface Water and Tidal Wetland Change dataset, respectively, in Google Earth Engine platform; (3) using cross-correlation to analyze time lags between suspended sediment discharge and land area changes in different deltas; (4) classifying all deltas based on their ratio of riverine, tidal and wave hydro- and sediment dynamic conditions (Qriver, Qtide, Qwave).
Results
Suspended sediment discharges have decreased in 38 of the global 94 major rivers since 1984, and increased in 37 of them, the rest remained relatively stable. Meanwhile, deltas gained 22,174 km2 and lost 17,572 km2 of wetland. As a result, its net gained area amounted to 4,602 km2 with an average building rate of 121 km2/yr. Besides, the net loss of mangrove and salt marsh lost in 82 river deltas (between 60°N and 60°S), respectively, accounted for 3,487 km2 and 2,471 km2 between 1999-2019; bare flat expanded 295 km2. Hence, the loss rate of deltaic wetlands reached 283 km2/yr in recent two decades. In particular, the Mississippi Delta and Mekong delta suffered the most dramatic wetland retreat (177 km2/yr and 42 km2/yr). While the Yangtze Delta and Ganges Delta showed the greatest increases (32 km2/yr and 23 km2/yr). We find that timeseries cross-correlations between riverine suspended sediment discharge and delta land area change show lagged effect over several in many deltas. But, more, and longer, field observations will be necessary to further constrain these findings.
References
Dethier, E.N., Renshaw, C.E., Magilligan, F.J., 2022. Rapid changes to global river suspended sediment flux by humans. Science, 376(6600), 1447-1452.
Pekel, J.F., Cottam, A., Gorelick, N., Belward, A.S., 2016. High-resolution mapping of global surface water and its long-term changes. Nature, 540(7633), 418-422.
Murray, N.J., Worthington, T.A., Bunting, P., Duce, S., Hagger, V., Lovelock, C.E., Lucas, R., Saunders, M.I., Sheaves, M., Spalding, M., Waltham, N.J., Lyons, M.B., 2022. High-resolution mapping of losses and gains of Earth’s tidal wetlands. Science, 376(6594), 744-749.
Nienhuis, J.H., Ashton, A.D., Edmonds, D.A., Hoitink, A.J.F., Kettner, A.J., Rowland, J.C., Törnqvist, T.E., 2020. Global-scale human impact on delta morphology has led to net land area gain. Nature, 577(7791), 514-518.
Acknowledgement
This study was financially supported by the National Key R&D Program of China (Grant No. 2023YFE0121200).
Long-term evolution of intertidal flats in the Western Scheldt under accelerated sea level rise
1 M.G. Aguilera Chaves, 2 M. van der Wegen, 3 M. Taal. M, 4 A. Colina Alonso, 5 B. Röbke.
1 Deltares, The Netherlands; 2 Deltares & IHE, The Netherlands; 3 Deltares, The Netherlands; 4 Deltares & TU Delft, The Netherlands; 5 Deltares, The Netherlands;
* Corresponding author: monica.aguilerachaves@deltares.nl
Introduction
Climate change and its effect on sea level rise (SLR) is increasing pressure in coastal areas. Moreover, SLR is expected to accelerate in the coming decades. The uncertainty associated to SLR rates raises concerns regarding the impact on coastal regions, particularly the ones that are relevant for their socio-economic and/or ecological value. Tidal basins and estuaries are examples of coastal systems that are vulnerable to accelerating SLR. Their existence depends on the balance between the creation of accommodation space under SLR (sediment demand), and the capacity of the coastal system to fill in this space (sediment supply) (Wang et al., 2018).
The Western Scheldt is an estuary located in the southwest of the Netherlands. It offers access to the port of Antwerp (Belgium) by means of a main navigation channel. In addition, there are intertidal flats along the basin that form habitats for marine species and birds (Elmilady, et al., 2022). These intertidal areas are prone to drowning under accelerating SLR. Therefore, understanding the development of the Western Scheldt under SLR, particularly the evolution of its intertidal flats, becomes crucial. Such knowledge allows planning an adequate coastal management for the long-term preservation of this system.
Objective and Methods
The objective of this research is to study the response of intertidal flats in the Western Scheldt to extreme SLR. For this purpose, a process-based model (Delft3D 4) is used. This corresponds to the Delft3D-Scheldt-SLR Model, which was developed by Röbke et al. (2020). This previous study aimed at determining the relative impact of SLR and different sediment strategies on the long-term hydrodynamics and morphodynamics in the Western Scheldt (period 2020-2100). As a sub-study, this research focusses on the behavior of intertidal area. The sediment strategies refer to the comparison of two dredging and dumping scenarios named current DAD and future DAD. Where dumping volumes vary. For the current DAD the material is placed on the shoals and in the channels of the estuary. While, for the future DAD, the sediment is dumped primarily in the deeper parts of the channels more located in the eastern part. The global SLR scenarios re based on the IPCC report (Church and Clark, 2013, and Le Bars et al., 2017). Various combinations of different SLR scenarios were performed with the two sediment strategies, and with multiple sediment fractions (sand only and sand-mud models).
Results
Here, the results are summarized for the sand-mud model with the current DAD. When there is no sea level rise (No SLR), the intertidal area increases over time in the Western Scheldt, mainly in the central part. Dumping of sand, from dredging activities, directly on top of the intertidal flats contributes to their expansion. In the landward side, even though the intertidal area remains constant, its composition changes. Sand volume decreases, while mud deposits increase.
The Western Scheldt is mostly flood dominant, but with SLR, this flood dominance decreases (Röbke et al., 2020). This causes mud import in the system to decrease. Under SLR, the intertidal areas decrease almost everywhere. The presence of sand drops along the estuary, especially near the landward side. Mud deposits near to the landward boundary. Despite the elevation of intertidal flats increasing with SLR, the sediment supply (even the one coming from the dredging activities) is not sufficient to maintain them. They start drowning with extremer SLR.
References
Church, J. and P. Clark, 2013. Sea level change. In T. Stocker, M. t. S. t. J. t. A. t. Y. t. V. t. D. QIN, G.-K. Plattner and P. Midgley, eds., Climate change 2013: the physical science basis. Contribution of working group I to the fifth assessment report of the Intergovernmental Panel on Climate Change. Cambridge University Press, Cambridge. Pp. 1137–1216.
Elmilady, H., van der Wegen, M., Roelvink, D., van der Spek, A., 2022. Modeling the morphodynamic response of estuarine intertidal shoals to sea-Level rise. Journal of Geophysical Research: Earth Surface 127: e2021JF006152. https://doi.org/10.1029/2021JF006152
Le Bars, D., Drijfhout, S. and de Vries, H., 2017. A high-end sea level rise probabilistic projection including rapid Antarctic ice sheet mass loss. Environmental Research Letters 12: pp. 1–9. doi:10.1088/1748-9326/aa6512
Röbke, B., Elmilady, H., van der Wegen, M., Taal, M., 2020. The long-term morphological response to
sea level rise and different sediment strategies in the Western Scheldt estuary (The Netherlands). Deltares, Delft, The Netherlands, pp. 98.
Wang, Z. B., Elias, E. P. L., Van Der Spek, A. J. F., & Lodder, Q. J., 2018. Sediment budget and morphological development of the Dutch Wadden Sea: Impact of accelerated sea-level rise and subsidence until 2100. Netherlands Journal of Geosciences, 97(3), 183–214. https://doi.org/10.1017/njg.2018.8
State of the Coast: Leveraging Global Datasets to Advance Local Scale Coastal Risk Assessments
C. Rowe1*, R. Ranasinghe2 , A. Luijendijk2 , E. Kras2, F. Calkoen2
1 IHE Delft Institute for Water Education, The Netherlands; 2 Deltares, The Netherlands
* Corresponding author: cro005@un-ihe.org ; Clenmar.Rowe@deltares.nl
Introduction
It is widely acknowledged that the coastal zone is among the world’s most rapidly developing, yet simultaneously, one of the most hazardous and exposed land-use areas. Despite their importance, these regions often lack the comprehensive data necessary for effective disaster management, including the installation of protective infrastructures. This lack of data is particularly evident in marginalized communities where resources are scarce and hampers efforts to identify and manage coastal risks, which is a crucial first step in disaster mitigation. This research aims to address this critical gap by leveraging global datasets to identify coastal risk levels on a global scale. By integrating data on hazards, exposure, and vulnerability, we can provide a more accurate picture of coastal risk levels, enabling better-informed decision-making and planning for disaster mitigation.
Objective and Methods
To achieve the objective of identifying global coastal risk levels, the study employs a multi-faceted approach. It begins with acquiring relevant datasets that capture information on hazards, exposure, and vulnerability across the globe. These datasets are then harmonized to ensure consistency and comparability. The next step involves the application of statistical classification methods and clustering algorithms to analyze the datasets and derive qualitative, standardized values for each indicator ranging between 1 and 5. The research employs a combination of both existing formulas from scientific literature and an expert "supervised" Machine Learning model to analyze the datasets and derive risk indices The global coastal risk levels at future time horizons, under the different climate projections, will be determined based on their corresponding variations in hazard magnitude. The results are formatted according to established standards like the Climate and Forecasting (CF) conventions to ensure interoperability with other climate-related datasets and models. Additionally, the research incorporates the use of SpatioTemporal Asset Catalogs (STAC) to facilitate data access and prevent the need for developing specific APIs. A web service will be hosted to allow interactive access to the risk information, including the ability to generate printable PDF summaries for a specified coastal area of interest.
Results
The anticipated result of this research is a robust, applicable coastal risk-level dataset that can be used to identify and screen particularly vulnerable shorelines worldwide. This risk level index and its constituent Hazard, Exposure, and Vulnerability datasets will provide valuable insights into the potential risks posed by natural hazards to coastal communities and infrastructure. An additional dataset integrated with future climate risk level projections will be produced and hosted on the web service. The option to toggle between both present and future climate risk level projections is expected to offer a forward-looking perspective. This will allow policymakers, planners, and community leaders in data-scarce regions to understand and prepare for the increasing impacts of climate change on coastal environments.
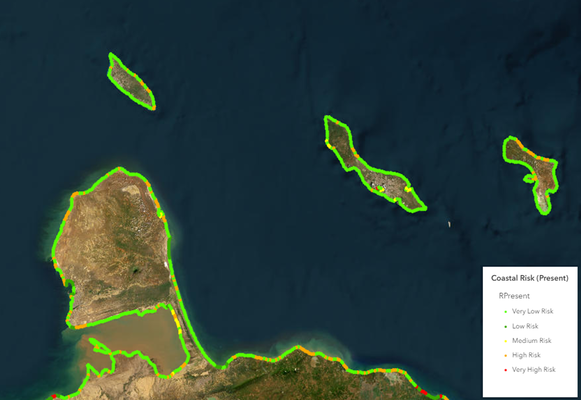
Figure 1 Sample dataset of the Netherlands Antilles, depicting an example of the expected result from this study
References
Athanasiou P, van Dongeren A, Giardino A, Vousdoukas M, Gaytan-Aguilar S, Ranasinghe R (2019) Global distribution of nearshore slopes with implications for coastal retreat. Earth Syst Sci Data 11: 1515-1529 DOI 10.5194/essd-11-1515-2019
Calkoen F, Luijendijk A, Rivero CR, Kras E, Baart F (2021) Traditional vs. machine-learning methods for forecasting sandy shoreline evolution using historic satellite-derived shorelines. Remote Sensing 13: 934
Gornitz VM, Daniels RC, White TW, Birdwell KR (1994) The development of a coastal risk assessment database: vulnerability to sea-level rise in the US Southeast. Journal of coastal research: 327-338
Koroglu A, Ranasinghe R, Jiménez JA, Dastgheib A (2019) Comparison of Coastal Vulnerability Index applications for Barcelona Province. Ocean & Coastal Management 178: 104799
Lemos G, Semedo A, Kumar R, Dobrynin M, Akpinar A, Kamranzad B, Bidlot J, Lobeto H (2023) Performance evaluation of a global CMIP6 single forcing, multi-wave model ensemble of wave climate simulations. Ocean Modelling 184: 102237
Luijendijk A, Hagenaars G, Ranasinghe R, Baart F, Donchyts G, Aarninkhof S (2018) The State of the World's Beaches. Sci Rep 8: 6641
Mclaughlin S, Cooper JAG (2010) A multi-scale coastal vulnerability index: A tool for coastal managers? Environmental Hazards 9: 233-248
Tebaldi C, Ranasinghe R, Vousdoukas M, Rasmussen D, Vega-Westhoff B, Kirezci E, Kopp RE, Sriver R, Mentaschi L (2021) Extreme sea levels at different global warming levels. Nature Climate Change 11: 746-751
Exploring Automatic Channel Network Detection in the Historic Western Scheldt
L. Beyaard1*, E.W. Nota1 , M.G. Kleinhans1
1 Utrecht University, Department of Physical Geography
* Corresponding author: l.beyaard@students.uu.nl
Introduction
Estuaries have complex morphodynamical patterns, which are mainly explored through the analysis of intertidal bars. Reliable visual identification of channels and their network has remained challenging, as ebb and flood channels evade one another and traverse bars. Even in well-studied estuaries such as the Western Scheldt, long-term channel network evolution has remained unexplored due to this. Here we use a novel channel network detection tool on historic elevation models of the Western Scheldt (Sonke et al., 2022).
Objective and Methods
In this research, we aim to characterize the channel pattern and its change in the historic Western Scheldt. A selection of historical hydrographic maps of the Western Scheldt and its mouth were digitized from 1804 until 1960. After converting time-specific reference levels to NAP, digital elevation models were obtained. The seven digital elevation models were used as input for the channel detection tool. This channel recognition tool computes local minima and steepest decent paths and then assigns ‘importance’ to paths based on a sand volume measure. A network of channels is obtained for every time step.
Results
From the turn of the nineteenth century, the main channel bends of the Western Scheldt have expanded towards the banks (Figure 1). The main channel sinuosity increased from 1.2 in 1804 to 1.4 in 1960. Smaller channels are generally located in similar positions throughout time. Fluctuations in their position and length occurred in response to complex bar development and land reclamations which disconnected secondary basins from the estuary. These positions were not sensitive to bathymetry resolutions below 200 m.
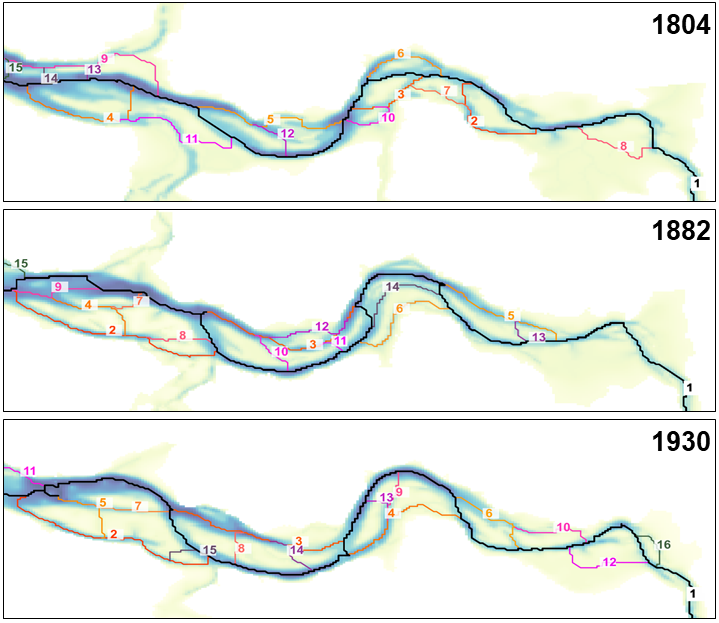
Figure 1: Channel networks derived for the historic Western Scheldt, from top to bottom for 1804, 1882 and 1930. Channel numbers indicate their importance, where the black line (1) is the main channel.
References
Sonke, W., Kleinhans, M. G., Speckmann, B., van Dijk, W. M., & Hiatt, M. (2022). Alluvial connectivity in multi-channel networks in rivers and estuaries. Earth Surface Processes and Landforms, 47(2), 477–490. https://doi.org/10.1002/esp.5261
The Roggenplaat intertidal flat nourishment: development of the sediment composition
N.P. Vermeer1*, P.L.M. de Vet1, A.T.M. de Bakker1, J.J. van der Werf1,2, V. Escaravage3, S. van Donk3, J. van Belzen3,4, T.J. Bouma4, H. de Looff5, K. Buis5
1Deltares; 2University of Twente; 3Wageningen Marine Research; 4NIOZ; 5Rijkswaterstaat
*corresponding author: nienke.vermeer@deltares.nl
Introduction
The construction of the Eastern Scheldt storm surge barrier (1986) resulted in intertidal flat erosion. This has negative effects on the natural as well as other values of the Eastern Scheldt. After all, the intertidal areas serve as a resting and foraging area for birds, marine mammals, and fish.
In the autumn of 2019, a large-scale nourishment (1.13 Mm3) was accomplished on the Roggenplaat (Eastern Scheldt), to compensate for the loss of bird foraging area. This Roggenplaat nourishment consist of seven elements, with each element being unique in terms of their location, elevation, and thickness of the sediment layer. Rijkswaterstaat, together with WMR, Deltares, NIOZ, Deltamilieu Projecten, and the HZ, has set up an extensive long-term eco-morphological monitoring campaign on the Roggenplaat since 2015 to evaluate the impact of this nourishment and to gather understanding on the mechanisms involved.
Objective and Methods
The sediment characteristics (e.g. grain size) are of key importance to the ecological development and functioning of the nourishment as it is one of the key factors determining recolonisation of benthic macrofauna. For example, too coarse sediment (especially in the absence of fines) implies lower moisture content which likely undermines recolonisation. The median grain size of the nourishment can be controlled to some extent, but there is little insight into how the grain size develops after nourishing.
Using an extensive dataset of grain sizes and silt content of the sediment of the Roggenplaat and the nourishments from 2015 (five years prior to nourishing) until 2022 (three years after nourishing), the evolution of these sediment parameters was studied. The number of sample points differed per sampling period, ranging from 30 in October 2019 to 208 in September 2022.
Results
The sediment samples provide insight into the development in grain size and silt content of the nourishments and surrounding areas. The median grain size of the nourishments was substantially larger (250/350 μm) than the surrounding areas (175/225 μm) (see Figure). The median grain size has been decreasing in recent years on all nourishments. Moreover, the silt content on the nourishments has been increasing, while immediately after nourishing there was no silt present on the nourishments. Research is still ongoing to identify which processes control these changes in grain size and silt content.
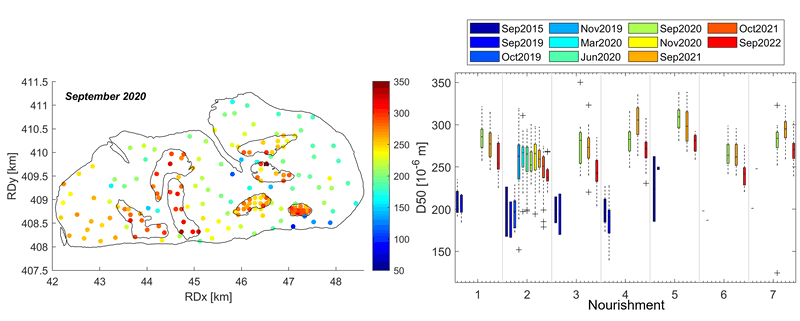
(left) Overview of the sampled median grain sizes for September 2020 (directly after nourishing) on the Roggenplaat. The contours and numbering of the nourishments and the low tide line are displayed. (right) The median grain size (D50) per sampling period per nourishment.
References
Van der Werf, J., M. Boersema, A. Nolte, R. Schrijvershof, J. Stronkhorst, L. De Vet, B. Walles, T. Ysebaert (2016b). Definitief ontwerp Roggenplaat suppletie. Centre of Expertise Delta Technology, Deltares rapport 1220324-000-ZKS-009.
How do shells of different shapes influence current-driven sand transport?
T.J. Kooistra1* , S.H. Haarbosch2 , J.W. Bosma3 , S.G. Pearson4, B.C. van Prooijen4, K. Soetaert1, R. Witbaard1,3, T.J. Bouma1,3
1Department of Estuarine and Delta Systems, Royal Netherlands Institute for Sea Research; 2Van Oord, Rotterdam, The Netherlands; 3Faculty of Geosciences, Utrecht University; 4Faculty of Civil Engineering & Geosciences, Delft University of Technology
* Corresponding author: tjitske.kooistra@nioz.nl
Introduction
The seabed rarely consists of bare sand: often other materials, such as shells are present. They can influence sand transport by armouring the bed and increasing its roughness, resulting in reduced ripple size and migration rate. Biogenic shells come in different shapes and sizes: some are round, while others are elongated. Even though they can persist in the sediment long after the animals that produced them have died, changes in species composition can alter the dominant shell types in surface sediments. For instance, the elongated shells of the invasive American razor clam (Ensis leei) are already the most found shells on Dutch beaches. To understand whether such changes in species composition could affect sediment transport, we need mechanistic understanding of the interactions of shell shape, near-bed flow and sand transport.
Objective and Methods
To test how elongated versus round shells influence current-driven sand transport, we performed experiments in a racetrack flume. We compared sandy beds with 10 or 20% shells of Ensis leei (elongated), Spisula subtruncata (round), or a mix of both types. In two types of experiments with (1) rapidly increasing current velocity and (2) constant current velocity, we determined the threshold of motion and quantified bedload transport of sand, respectively. We explain the effects of transport by looking at how the shells influence turbulent kinetic energy (TKE) and bed roughness. Furthermore, we photographed the bed over time to determine surface roughness and shell coverage.
Results
Compared to a bare sand bed, shells increased the threshold of motion of sand in a water-worked bed. Bedload transport of sand containing 20% shells was lower than in a bed with no shells. At 10% shells, the decrease of bedload transport was less apparent. Although more turbulence was created by elongated compared to round shells, there was no clear difference in effects on threshold of motion or bedload transport between the two types of shells. Eventually, these results help our understanding of the impact of biota on sand transport and in could aid in improving sediment transport predictions.
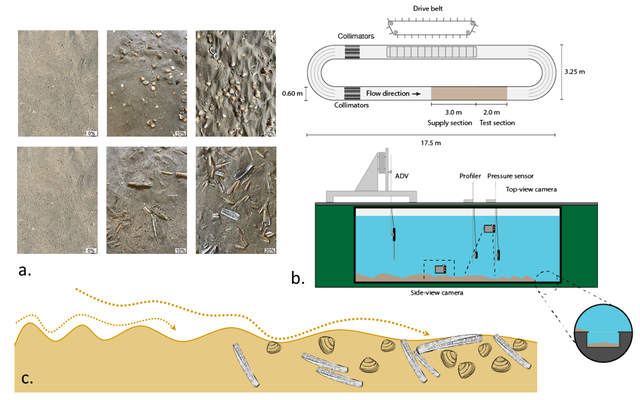
Schematical overview of the experiment: pictures of sandy beds with 0, 10 or 20% Ensis or Spisula shells (a); flume setup (b) and bed armouring by shells (c).
Length-scales of similarities in coastal morphological behaviour
L.W.M. Roest1,2*, P. Rauwoens1
1 KU Leuven, Belgium; 2 IMDC, Belgium
* Corresponding author: bart.roest@kuleuven.be
Introduction
Sandy coasts exhibit a continuous morphological evolution under external forcing due to wind, waves, tidal currents and human interference. It is generally accepted in geomorphology that features closer together show more similarities than those far apart. Likewise, beach profiles close together are subject to similar external forcings and therefore expected to show similar morphological behaviour.
The Belgian coast is surveyed at least every year, and has been for the past 30 to 40 years, depending on the location. The morphological evolution is reported in terms of sediment volume changes per coastal section (ca. 250 m alongshore, 1500 m cross-shore). In previous reports similar-looking sections have been pragmatically grouped together. However, it appears that the morphological development in different parts of the coastal profile may (or may not) show contrasting trends, i.e. the beach may be accreting, while the shoreface is eroding and vice-versa. Here we determine zones of coherent morphological behaviour in different parts of the coastal profile and the length-scales involved.
Objective and Methods
Morphological behaviour of the Belgian coast is assessed via timeseries of sediment volume changes per coastal section (about 250 m alongshore), spanning 30 to 40 years. These volume changes are derived for several horizontal layers over the profile, named: dune foot, dry beach, intertidal beach, shoreface and seabed. These layers are subject to different (combinations of) forcing mechanisms, thus differences in morphological behaviour between layers in the same section may be expected.
Linear (Pearson) correlations between individual pairs of volume timeseries are made, resulting in a correlation matrix of correlation coefficients (rij) for each layer. Positive correlations indicate similar trends, while negative correlations indicate opposing trends. Length-scales are derived from ‘blocks’ of high correlation (r>0.7), adding-up the respective alongshore section lengths.
Since the dry beach and dune foot are frequently nourished along large portions of the coast for coastal safety and recreational purposes, the sediment volume in these layers has generally increased there over the past decades. Corrections for nourished volumes are the subject of further research.
Results
Correlations are found both locally, as well as remotely. Locally coherent blocks of high correlation exist, yet similar behaviour is also found elsewhere along the coast limiting the number of behaviour classes. It was also found that correlations found in one layer do not automatically imply correlations in other layers over the same areas.
Correlations on the dry beach and dune foot layers are generally high and most sections are (weakly) positively correlated to each other with few exceptions (Figure 1, above diagonal). Lengths of coherent behaviour vary along the coast. In the west, two blocks of 4.5 and 5.5 km are present, while in the central area separation is less clear forming a block of about 15 km west of Oostende, and 4 to 6 km blocks to the east. East of Zeebrugge, coherent blocks are small with alternating blocks between 1 and 3.5 km.
The shoreface (Figure 1, below diagonal) shows more contrasting behaviour, with several clearly separated coherent blocks of 1 to 2.5 km at the west coast, 4.7 km at Oostende, 3.7 and 3.2 km west and east of Zeebrugge harbour. The rest of the coast apparently shows more gradual differences in behaviour with no clear separation between adjacent sections, yet diminishing correlations over distances larger than 3km. Examples of opposing trends are the continuous accretion west and east of Zeebrugge harbour, while the shoreface is eroding along the Appelzak (km 58-63) and Potje (km 1-4) tidal channels (Figure 1, below diagonal).
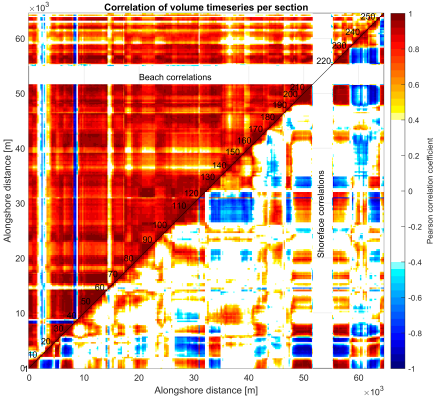
Figure 1: Correlation matrix generated by correlating volume timeseries of individual pairs of coastal sections along the Belgian coast. Positive correlations (warm colours) indicate similar coastal behaviour, negative correlations (cold colours) indicate opposing behaviour. Above the diagonal: correlation coefficients of beach and dune foot volume changes. Below the diagonal: correlation coefficients of shoreface volume changes. Section numbers are indicated on the diagonal.
Multi-temporal shoreline dynamics of the repeatedly nourished coast of Egmond-Bergen quantified from satellite imagery
J.S. Löhr1*, B.G. Ruessink1 , T.D. Price1
1 Utrecht University, The Netherlands
* Corresponding author: j.s.lohr@students.uu.nl
Introduction
Climate change is expected to worsen erosion of many sandy coastlines globally in the future. Nowadays, a total amount of approximately 12 million m3 of sand is annually nourished to maintain the Dutch coastline, mainly consisting of beach and shoreface nourishments. However, knowledge is still limited of the effects of beach and shoreface nourishments on the dynamics of the shoreline and its (long-term) temporal and spatial trends, especially in the case of repeated sand nourishments. The latter is of particular relevance, because nourishment efforts are likely to increase in the future due to sea level rise. The overarching objective of this study was to quantify and hence better understand shoreline dynamics of high-energy, low-sloping beaches that are repeatedly nourished.
Objective and Methods
The Python toolkit CoastSat (Vos et al., 2019) has been used to extract time-series of cross-shore shoreline position from satellite imagery (Landsat 5, 7, 8, 9 and Sentinel-2) for the period between 1985 and 2023 for a 13.5 km stretch of coast located in front of the Dutch beach towns of Castricum, Egmond and Bergen. The northern part at Egmond and Bergen has been repeatedly nourished while the southern part remained unnourished during the studied period. The instantaneous shorelines were adjusted to a standard reference level to account for the influence of tides, wave runup and storm surge. Subsequently, the temporal variability in the shoreline could be studied (storms, seasons, long-term trends), as well as the spatial shoreline changes in response to the repeated nourishments.
Results
The results, illustrated as a space-time diagram in Figure 1, show that the repeated sand nourishments led to a gradual seaward expansion of the shoreline over time with an increasing interannual trend of 2.00 m/yr in the nourished section (to the right of alongshore beach pole 4000), while the unnourished section (to the left of alongshore beach pole 4000) remained more or less stable (+0.31 m/yr). The shoreline further presents itself to be very robust with only small seasonal cycles (amplitude of c. 10 m) and a minor (if any) response to storm events. The beach nourishments constructed between 1990 and 2000 only resulted in relatively small (< 10 m) and temporary (< 1 - 2 years) localised progradation of the shoreline. In contrast, the repeated shoreface nourishments at the nourished section (often in combination with a beach nourishment), in the longterm, led to a much more prominent seaward advance (~50 m) of the shoreline. The nearby non-nourished beaches, on the other hand, did not exhibit this seaward advance of the shoreline, suggesting limited alongshore dispersal of the nourished sand to the adjacent shorelines.
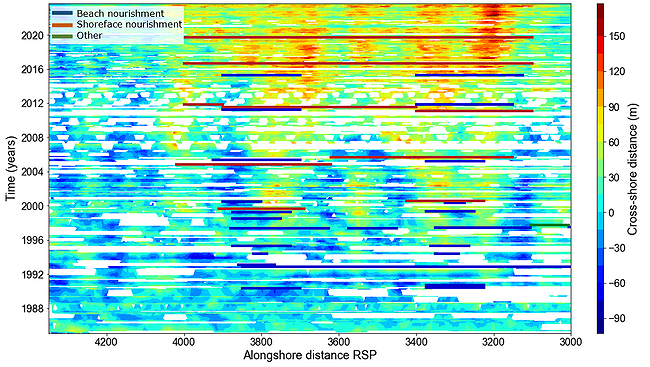
Figure 1: Spatiotemporal evolution of the shoreline with the timing and alongshore extent of the beach and shoreface nourishments. The alongshore distance is expressed as beach pole distance (RSP) with, for instance, one kilometre between beach poles 3000 and 3100. Blue colours represent a more landward situated shoreline, while orange and red colours represent a more seaward situated shoreline. North is to the right and south is to the left. The blank spaces between the data represent missing values.
References
Vos, K., Splinter, K. D., Harley, M. D., Simmons, J. A., & Turner, I. L. (2019). CoastSat: A Google Earth Engine-enabled Python toolkit to extract shorelines from publicly available satellite imagery. Environmental Modelling & Software, 122, 104528. https://doi.org/10.1016/j.envsoft.2019.104528
Sediment and nourishment demand of the Dutch coast under sea level rise
Laura Brakenhoff1*, Ellen Quataert2, Marcel Taal2, Quirijn Lodder1
1Rijkswaterstaat, The Netherlands; 2Deltares, The Netherlands
*Corresponding author: laura.brakenhoff@rws.nl
Introduction
Starting in 1990, the strategic goals of Dutch coastal management are to sustainably maintain the flood protection and to sustainably preserve other functions of the dune areas (Ministry of Transport and Water Management (MinV&W), 1990). In 2000, an extra tactical goal was added; besides preserving the coast line, also the sediment budget of the Coastal Foundation should be kept in equilibrium with sea level rise (MinV&W, 2000). The Coastal Foundation is defined here as the area between 20 m water depth and the inner dunes. In practice, these goals are achieved through sandy nourishments on the shoreface, beach or channel walls.
Under accelerated sea level rise, it is unclear whether we can achieve the above-mentioned policy goals with nourishments only. Therefore, it is essential to know how much sand is needed to protect and preserve the coast. To answer these (and many more) questions, the Sandy Coast theme within the Knowledge Programme Sea Level Rise (KP SLR) was set up.
Objective and Methods
In this project, Deltares and Rijkswaterstaat studied the physical impact of 0.5, 1, 2, 3 and 5 m of sea level rise on the sediment and nourishment demand of the coastal system. First, it was studied which part of the Coastal Foundation has been receiving the sediment that was nourished over the last 57 years. It was concluded that only this part (the ‘active zone’) should grow with sea level rise, instead of the Coastal Foundation as a whole.
The cumulative sediment demand of the system (in m3/year) is determined by multiplying the area of the active zone by each SLR-value. This sediment demand is then corrected by the expected sediment transport in/out of the system (e.g. transport towards the Wadden Sea).
The sediment demand can be seen as a morphological characteristic of the coastal system. The nourishment volumes are not always equal to this value. At the Holland coast, the nourishment volumes are higher than the sediment demand, in order to keep the coastal towns (‘bolwerken’) in place. At the North Sea coast of the Wadden, the nourishment volumes are smaller than the sediment demand, because currently, around 50% of the sediment export to the Wadden Sea needs to be compensated.
Results
The area in which the nourished sand spreads is much smaller than the Coastal Foundation. In general, it extends to a water depth of approximately 10 m. This implies that the sediment demand under (extreme) sea level rise is smaller than previously assumed. For a sea level rise of 5 m, the cumulative sediment demand for the entire Dutch coast ranges between 7 and 12×109 m3. The nourishment demand ranges between 5 and 12×109 m3. Even though these are very large volumes of sand, continuing the current strategy of nourishing 11×106 m3/y until the year 2200 results in almost 2×10⁹ m3 of nourished sand. Assuming that 5 m sea level rise occurs in 2200 thus increases the nourishment volumes by only 2.5 to 6 times with respect to current volumes.
Although the results regarding the nourishment volumes are encouraging, it is still imperative that spatial planning reservations are made regarding sediment availability. At present, it is sometimes difficult to find the correct sand for nourishments, these issues are likely to increase in the future without appropriate planning.
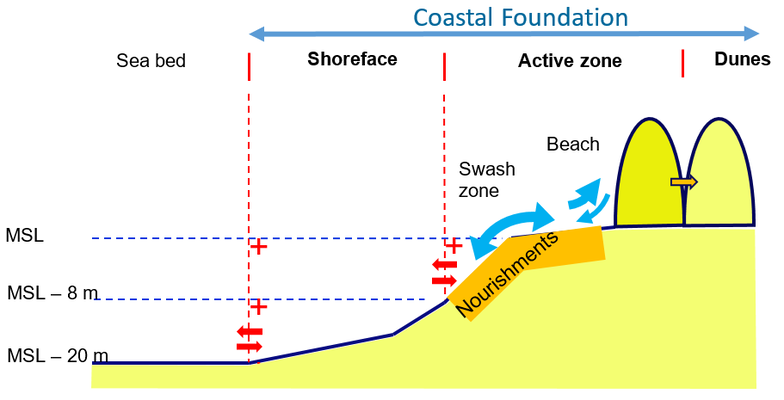
Cross-section of a coastal profile, indicating the difference between the Coastal Foundation and the Active zone, in which the nourishments spread.
References
Ministry of Transport and Water Management (1990). Kustverdediging na 1990.
Ministry of Transport and Water Management (2000). Derde kustnota: traditie, trends en toekomst
Simulation of aeolian sediment transport with inter-particle moisture using Discrete Particle Modelling
X. Wang1*, G.H.P. Campmans1, T. Weinhart1, A.R. Thornton1, S. Luding1, K.M. Wijnberg1
1 University of Twente, the Netherlands
* Corresponding author: x.wang-8@utwente.nl
Introduction
Moisture plays a critical role in the dynamics of aeolian sediment transport over coastal sandy beaches. It was found from field observations that the transport over wet beach surfaces is fundamentally different from that over dry surfaces (Swann, 2021). Despite many empirical findings about the moisture effect on the threshold and transport flux, the small-scale mechanics that inter-particle moisture affects the development of transport from initiation towards equilibrium remains poorly understood (Cornelis & Gabriels, 2003).
Objective and Methods
To gain some insights into the influence of moisture on aeolian sediment transport, we introduce a discrete particle model integrated with a liquid migration model, enabling the simulation of moisture’s dynamic behavior. The model is coupled with a one-dimensional air flow model in two directions, facilitating the momentum exchange between the solid phase and the air phase. We conducted transport simulations across various wind strengths and moisture contents to systematically demonstrate the impact of moisture.
Results
Our results show that the existence of liquid bridges enhances the bed resistance against erosion, and the mechanism of introducing wet particles into saltation is by particle impact that stimulates the rupture of those liquid bridges. We further identify the liquid redistribution in the vertical direction, which is accompanied with intensive saltation. This leads to dry-particle-like transport behavior in the equilibrium state, suggesting that the moisture effect can vary with the phase of transport. The findings provide implications for bed form development at coastal sandy beaches.
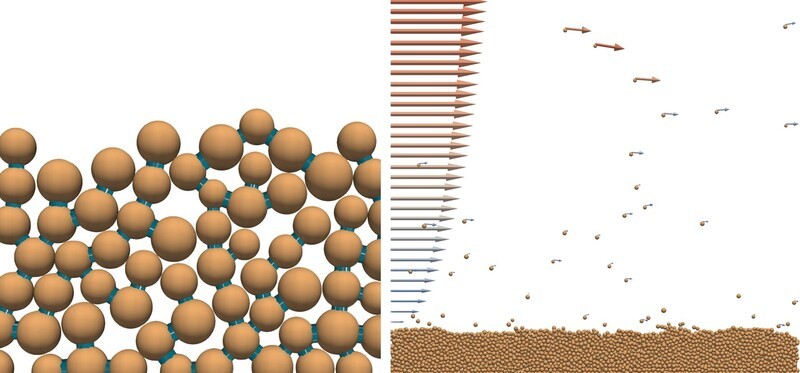
Model snapshots: left) Particles connected by liquid bridges; Right) Particles transported by wind (The arrows show the velocity of particles and airflow).
References
Cornelis, W. M., & Gabriels, D. (2003). The effect of surface moisture on the entrainment of dune sand by wind: an evaluation of selected models. Sedimentology, 50(4), 771-790.
Swann, C., Lee, D., Trimble, S., & Key, C. (2021). Aeolian sand transport over a wet, sandy beach. Aeolian Research, 51, 100712.
Human footprint on tides dominates water levels in estuaries around the world
J.G.W. Beemster1*, S.A. Talke2, B. van Maren3,4,5 and A.J.F. Hoitink1
1 Hydrology and Environmental Hydraulics Group, Wageningen University and Research, Wageningen, The Netherlands; 2 Department of Civil and Environmental Engineering, California Polytechnic State University, San Luis Obispo, CA, USA; 3 State Key Lab of Estuarine and Coastal Research, East China Normal University, Shanghai, China; 4 Faculty of Civil Engineering and Geosciences, Delft University and Technology, Delft, The Netherlands; 5 Deltares, Marine and Coastal Systems Unit, Boussinesqweg 1, Delft, The Netherlands
* Corresponding author: joris.beemster@wur.nl
Introduction
Estuaries and tidal rivers represent critical coastal ecosystems, profoundly influenced by human activities over centuries. Anthropogenic interventions such as land reclamation and channel deepening have transformed these environments, altering estuarine hydrodynamics and water level patterns. Understanding the complex interplay between human alterations and natural tidal dynamics is essential for assessing the resilience of coastal regions in the face of rising sea levels and changing climatic conditions. This study investigates the impact of human interventions on tidal hydrodynamics in 18 estuaries scattered around the globe. By recovering, digitizing, collecting and examining historical data of estuarine geometry and tidal patterns, we unravel centennial-scale changes of estuarine tidal dynamics and discuss the extent to which human activities have influenced tidal amplitudes, water level extremes, and the spatial distribution of this influence.
Objective and Methods
The objective of this study is to aevaluate the effects of human interventions on tidal hydrodynamics in 18 estuaries around the world. We conducted a comprehensive analysis of historical data spanning multiple decades to centuries, focusing on estuarine geometry, tidal amplitudes, and water level extremes. Our methodology involved collating and analyzing long-term hydrodynamic and geometric data from each estuary. Next, we determined characteristic geometric (e.g. average channel depth, intertidal area) and hydrodynamic (e.g. max tidal range, mean annual discharge) variables over time to understand how changes in geometry affect hydrodynamic behavior. By integrating historical insights with contemporary data, we aim to understand the complex dynamics governing the interaction between human activities and natural tidal processes.
Results
Preliminary analysis reveals significant alterations in tidal hydrodynamics across the 18 estuaries studied. Human interventions, particularly channel deepening, land reclamation and barrier construction, have led to widespread changes in tidal amplitudes and water levels. Our results indicate a general trend of tidal amplification, with the most pronounced effects observed in the landward reaches of estuaries, generally exceeding rates of sea level rise. The spatial distribution of tidal effects suggests a complex interplay between estuarine geometry and human alterations, with narrow funnel-shaped estuaries exhibiting heightened sensitivity to anthropogenic interventions. These findings underscore the pervasive influence of human activities on estuarine hydrodynamics and highlight the need for adaptive estuarine management strategies in the face of changing environmental conditions.
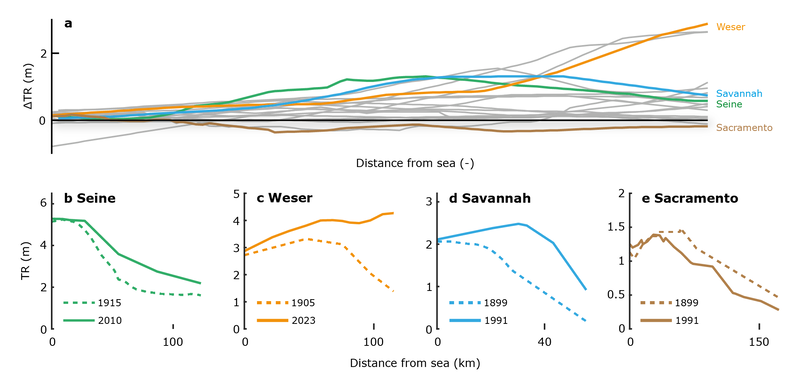
Changes of the tidal range in the eighteen estuaries. a. Along channel changes of the tidal range for the 18 estuaries included in our study, the distance to the sea is normalized by the distance to the most landward observation, along channel profiles of the tidal range in b. the Seine in 1915 and 2010, c. the Weser in 1905 and 2023, d. the Savannah in 1899 and 1992, and e. the Sacramento in 1899 and 1992.
Saltwater entrainment from bathymetric depressions: A CFD analysis from a laboratory cavity to a scour hole in the Haringvliet estuary
Ashraf A. Almohagrya*, Tom O’Mahoneyb, Fateme Ebrahimi Eramia, Vasileios Kitsikoudisa, Suzanne J. M. H. Hulschera
a Department of Water Engineering and Management, University of Twente, Enschede, The Netherlands; b Hydraulic Engineering, Deltares, Delft, The Netherlands
* Corresponding author: ashraf.almohagry@gmail.com
Introduction
Saltwater intrusion is a significant challenge in semi-enclosed estuaries, such as the Haringvliet. The Haringvliet is a large inlet of the North Sea that was closed in 1970 as part of the Delta Works in the Netherlands (Kranenburg et al., 2023). Saltwater intrusion leads to the formation of saline pools in scour holes within the estuary. Mitigating saltwater intrusion involves the determination of the freshwater discharge during ebb tide that is needed to flush out the saltwater that has entered the system during flood tide. In the Haringvliet, the biggest challenge is to determine the minimum discharge that is needed to effectively flush out the saltwater from the scour holes. The urgency for precise freshwater management strategies has increased because of the anticipated freshwater scarcity due to climate change. Despite existing studies on flushing saltwater from cavities, there is a knowledge gap in quantifying the saltwater entrainment rate from real-life scour holes. This study addresses this knowledge gap by studying the saltwater entrainment rate from a real-life scour hole using Computational Fluid Dynamics (CFD) models validated against both lab-scale and field-scale flows.
Objective and Methods
This research aimed to accurately predict the saltwater entrainment rate from a scour hole in the Haringvliet. Using Star CCM+ software, a model was developed consisting of a cavity, initially filled with saltwater, with a flow of freshwater above it entraining saltwater and causing the freshwater-saltwater interface to drop over time. The methodology involved creating 2D models based on the Reynolds-Averaged Navier-Stokes approach and 3D models employing the Detached Eddy Simulation (DES) approach. The model performance in predicting the saltwater entrainment rates was validated against the laboratory results of Debler and Armfield (1997). The best-performing lab model was then scaled up to match the parameters and geometry of a scour hole in the Haringvliet. The performance of this field-scale model was further validated using field data from a large flushing event on the 17th of February 2023, including measurements from Acoustic Doppler Current Profilers (ADCPs). The ADCP data were utilized to locate the points of maximum velocity gradient across each vertical profile, as seen in Figure 1a. Averaging these points allowed for obtaining the freshwater-saltwater interface height, as shown in Figure 1b, which was then used to evaluate the model's performance in predicting the temporal variations of the freshwater-saltwater interface.
Results
The sensitivity analysis showed that the Star CCM+ software performed relatively better in predicting the saltwater entrainment in the Haringvliet model compared to the lab-scale models. In contrast to the Haringvliet model, the lab-scale model displayed strong turbulence and notable vortex formations resulting in overpredictions of the entrainment rate. The DES-modeled drop of the freshwater-saltwater interface in the Haringvliet scour hole, compared with the drop from the field observations, yielded small RMSE values ranging between 0.40 and 0.82 m, indicating good model performance. In addition, the modelled pycnocline's inclination matched the one observed from the ADCPs data, where the saltwater level at the downstream part of the scour hole was higher than the saltwater level at its upstream part. Overall, the Haringvliet CFD model predicted well the temporal changes in the freshwater-saltwater interface height and the inclination of the pycnocline over the simulated period.
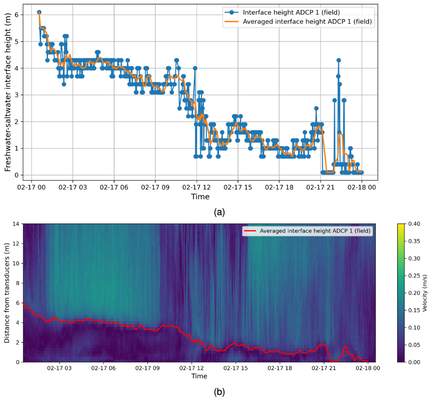
Figure 1. (a) Averaged freshwater-saltwater interface height estimated from the velocity profiles; (b) Estimated freshwater-saltwater interface height overlaid on field velocity measurements.
References
Debler,W., & Armfield, S.W. (1997). The purging of saline water from rectangular and trapezoidal cavities by an overflow of turbulent sweet water. Journal of Hydraulic Research, 35(1), 43–62. https://doi.org/10.1080/00221689709498643
Kranenburg, W. M., Tiessen, M. C., Blaas, M., & Van Veen, N. P. (2023). Circulation, stratification and salt dispersion in a former estuary after reintroducing seawater inflow. Estuarine, Coastal and Shelf Science, 282, 108221. https://doi.org/10.1016/j.ecss.2023.108221
The effectiveness of fresh-water pulses to mitigate salt intrusion into the Lek River
Y. Huismans1,2*, L. Leummens1, S.M.T. Rodrigo1, S.C. Laan1, W.M. Kranenburg1,2, R. van der Wijk1, N.P. van Veen3
1 Deltares, the Netherlands; 2 Delft University of Technology, the Netherlands; 3 Rijkswaterstaat, the Netherlands
* Corresponding author: Ymkje.Huismans@Deltares.nl
Introduction
Salinity intrusion occurs naturally in estuarine systems and is strongly governed by the tidal conditions and river discharge (Fischer et al., (1979)). Therefore, most of the freshwater intakes are located far upstream. However, during events of low river discharge or wind setup, salt can intrude far into the system. One of the most effective methods to mitigate salt intrusion is to increase the river discharge (Hendrickx et al., 2023), for example by locally diverting additional water. This is also the main measure applied for keeping intakes along the Lek River – a side branch of the Rhine-Meuse Estuary (figure 1a) – fresh (van den Brink et al., 2019). The additional water, however, comes from the Waal River, where it is needed to guarantee sufficient depth for navigation. As a result, it is important to be as efficient as possible when supplying additional water to the Lek River. To determine the suitable timing and amount for adjusting the discharge through the Lek River, in-depth understanding of the efficacy across different discharge and tidal scenarios, as well as response times, is needed.
Objective and Methods
The objective of this study is to provide the necessary knowledge to arrive at guidelines for optimizing the amount and timing of a freshwater pulse through the Lek River. This includes determining conditions at which the Lek River salinizes, the spatial and temporal reduction in salt intrusion that can be achieved by providing a freshwater pulse, and related response times. For this we applied a detailed 3D Flexible Mesh model for the entire Rhine-Meuse Estuary, which has been validated for water levels, discharge distribution and salinity intrusion (Van der Kaaij et al., 2022). We examined the influences of three primary factors on salt intrusion in the Lek River: 1) the discharge entering the Rhine-Meuse Estuary, 2) the water levels at sea, including a spring-neap tidal cycle and wind setup, and 3) the discharge on the Lek River itself. To isolate the impact of each parameter on salt intrusion, we varied them individually. In addition, we carried out a data-analysis of salinity and discharge measurements of the Lek River from 2022.
Results
From the simulations it follows that only for very low river discharges the salinity front of 200 mg Cl/l passes a critical freshwater intake. Wind setup significantly influences salt intrusion (see Figure 1b,c), with a 50 cm variation leading to displacement of several kilometers in intrusion length. The change in length and response time correlate with the substantial additional water volumes entering and leaving the Lek River due to variations in wind setup.
The efficacy of an additional discharge on the Lek River varies spatially (see Figure 1d,f). While chloride concentrations are most significantly reduced at the river mouth in absolute terms, the relative effect increases in upstream direction, until reaching the river section with near background chloride concentrations. This aligns with expectations, as chloride concentrations near the river mouth are primarily influenced by the main branch (Nieuwe Maas), which has a discharge one order of magnitude higher than the Lek River. With wind setup, effectiveness slightly increases (see Figure1 e,g). Consistent with previous findings (Biemond et al., 2022), the response time of salinity is faster for increasing discharge than for decreasing discharges.
The above findings will be used to formulate a new advice for steering discharge over the Lek River.
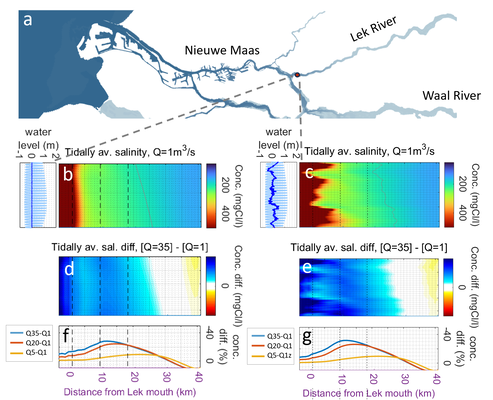
Map of the Rhine-Meuse Estuary (a). Chloride concentration on the Lek River for a pure spring-neap tidal cycle (b) and including wind setup (c), both for a Lek discharge of 1 m3/s and a discharge entering the Rhine Meuse Estuary of 450 m3/s. Water levels and surge displayed in the side panel. Reduction in chloride concentration due to extra discharge over the Lek River (5, 20 or 35 m3/s) for a pure spring-neap tidal cycle (d,f) and including wind setup (e,g).
References
Biemond, B., de Swart, H. E., Dijkstra, H. A., & Díez-Minguito, M. (2022). Estuarine salinity response to freshwater pulses. Journal of Geophysical Research: Oceans, 127, e2022JC018669. https://doi.org/10.1029/2022JC018669
Fischer H.B., List E.J., Koh R.C.Y., Imberger J., Brooks N.H. (1979) Mixing in Inland and Coastal Waters Academic Press (1979), 10.1016/C2009-0-22051-4
Hendrickx, G.G., Kranenburg, W.M., Antolínez J.A.A., Huismans, Y., Aarninkhof, S.G.J., Herman, P.M.J. (2023), Sensitivity of salt intrusion to estuary-scale changes: A systematic modelling study towards nature-based mitigation measures, Estuarine, Coastal and Shelf Science, 295, 108564, https://doi.org/10.1016/j.ecss.2023.108564.
Kaaij, T. v.d., Chavarrias, V. & Kranenburg, W.M. (2022). RMM 3D, een nieuw 3D model van de RijnMaasMonding in D-HYDRO; Vergelijking met zout- en debietmetingen najaar 2018. Delft: Deltares rapport 11206813-007-ZWS-0002. Versie 1.0 (definitief).
van den Brink, M.; Huismans, Y.; Blaas, M.; Zwolsman, G. (2019) Climate Change Induced Salinization of Drinking Water Inlets along a Tidal Branch of the Rhine River: Impact Assessment and an Adaptive Strategy for Water Resources Management. Climate, 7, 49. https://doi.org/10.3390/cli7040049
The Influence of Estuarine Sand Dunes on Salt Intrusion
S.J. Geerts1,2*, W.M. van der Sande1, S.J.M.H. Hulscher1, B.J. Geurts2, P.C. Roos1
1 Department of Water Engineering and Management, Faculty of ET, University of Twente, Enschede, the Netherlands; 2 Mathematics of Multiscale Modelling and Simulation (3MS), Faculty of EEMCS, University of Twente, Enschede, the Netherlands;
* Corresponding author: s.j.geerts@utwente.nl
Introduction
Saltwater intrusion in estuaries can pose a critical issue with significant implications for human activities such as industry, agriculture and drinking water extraction, and can be unfavourable to environmental sustainability. This phenomenon arises when saline water infiltrates the estuarine system, potentially leading to a shortage of freshwater. The intensity of salt intrusion is influenced by various factors, of which freshwater river flushing and the amount of vertical transport in the flow are key predictors (Geyer & MacCready, 2014).
This study investigates the impact of estuarine sand dunes, bedforms with heights in the order of meters and lengths of tens to hundreds of meters (Zorndt et al., 2011), on salt intrusion. Estuarine sand dunes potentially increase the net vertical flux, by an increase in large-scale turbulence, tide-averaged circulation cells and resonant internal waves. An increase in vertical transport generally decreases stratification and reduces salt intrusion. We determine the potential of estuarine sand dunes as a nature-based solution against salt intrusion and investigate the complex salt transport dynamics over these bedforms on an estuarine scale.
Objective and Methods
We investigate the influence of estuarine sand dunes on salt intrusion using an idealised morphostatic model with 2DV geometry, implemented in Delft3D-FLOW. This enables us to specifically study the effect of vertical flow behaviour without possible interference from other estuarine-scale parameters. Our model is designed to investigate estuarine systems that can be approximated as a single-channel estuary with relatively uniform geometry. In this study, model settings are based on the Rotterdam Waterway, the Netherlands, during low river flow velocities, when salt intrusion is most detrimental. The model effectively captures most of the flow, salt transport behaviour, and turbulent eddy diffusivity representative of field measurements of the Rotterdam Waterway (de Nijs et al, 2011) and other modelling studies (Dijkstra et al., 2022).
We focus on two dune configurations: we vary the dune characteristics (such as dune height, dune length and asymmetry) while (a) maintaining the mean water depth, and (b) maintaining the navigable depth, both visualised in Figure 1. We determine the influence of these geometric changes on the salt intrusion length, which is defined as the tide-averaged distance from the seaward end where the maximum concentration over the water column equals 1 ppt.
Results
Across all model runs, the presence of estuarine sand dunes does not qualitatively change the dominant transport mechanisms and stratification. A different salt intrusion length may form by a changing balance of transport components. (a) An increase in dune height enhances vertical advective transport, which reduces the salt intrusion length significantly (bottom-left panel in Figure 1). Similarly, a decrease in dune length increases the dune slope and enhances the vertical exchange, although the influence is not of the same order of magnitude for dune lengths evaluated (50 m to 250 m). Dune asymmetry has a negligible influence on our model results, which likely results from the hydrostatic assumption. (b) Small dredged dunes increase the salt intrusion as the channel is deepened (bottom-right panel). For larger dune heights, salt intrusion is significantly decreased, which follows the trend of method (a) (middle panel). The change in salt intrusion length can be attributed to advective vertical transport, as changes in dispersive transport are negligible. Generally, the salt intrusion length is inversely proportional to the mean amount of vertical transport throughout the region of stratification.
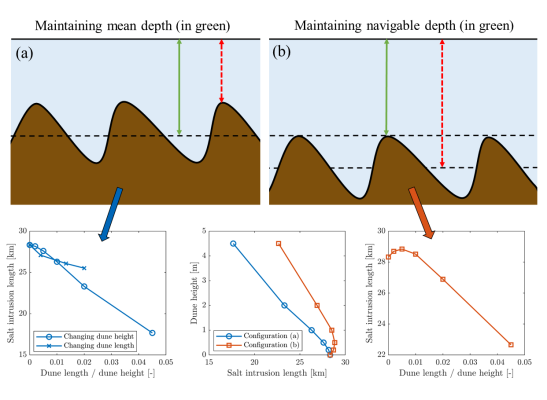
Top: visualisation of the two dune configurations that (a) maintain mean depth and (b) maintain navigable depth. Maintained depths are indicated in green and changing depths are indicated in red. Bottom: Influence of changing dune geometry on salt intrusion length with the panels; left: dune configuration (a), right: dune configuration (b) and middle: dune height only for both configurations.
References
de Nijs, M.A.J., Pietrzak, J.D. & Winterwerp, J.C., (2011). Advection of the salt wedge and evolution of the internal flow structure in the Rotterdam Waterway. Journal of Physical Oceanography, 41 (1), 3-27. https://doi.org/10.1175/2010JPO4228.1
Dijkstra, Y.M., Schuttelaars, H.M., & Kranenburg, W.M. (2022). Salt transport regimes caused by tidal and subtidal processes in narrow estuaries. Journal of Geophysical Research: Oceans, 127. https://doi.org/10.1029/2021JC018391
Geyer, W.R., & MacCready, P. (2014). The estuarine circulation. Annual review of fluid mechanics, 46, 175–197. https://doi.org/10.1146/annurev-fluid-010313-141302
Zorndt, A.C., Wurpts, A., & Schlurmann, T. (2011). The influence of hydrodynamic boundary conditions on characteristics, migration, and associated sand transport of sand dunes in a tidal environment: A long-term study of the Elbe estuary. Ocean Dynamics, 61, 1629–1644. https://doi.org/10.1007/S10236-011-0452-1
Tidal phase differences in multi-branch systems and their effect on salinity intrusion
J. de Wilde1*, W.M. Kranenburg1,2 , Y. Huismans1,2, J.D. Pietrzak1, G.G. Hendrickx1
1 Delft University of Technology; 2 Deltares
* Corresponding author: j.dewilde-1@student.tudelft.nl
Introduction
The Hollandsche IJssel plays an important role in the freshwater provision of the province Zuid-Holland. Consequently, for Rijkswaterstaat it is key that salt intrusion is minimal in the Hollandsche IJssel. Recent studies noted that currently, salt intrusion in the Hollandsche IJssel is limited due to a phase difference between tidal velocities in the main channel, the Nieuwe Maas, and the side channel, the Hollandsche IJssel (Kuijper, 2015, 2016; Laan et al., 2021). Earlier, Okubo (1973) and MacVean and Stacey (2011) investigated the impact of phase differences between branches and found it can lead to increased dispersion in the main channel, a process known as tidal trapping. At the same time, this phase difference can prevent the saltiest water from entering the side channel, as was found at the Hollandsche IJssel. Because of this role, it is relevant to find out how this phase difference may be influenced by sea level rise, more extreme river discharges and particularly how it depends on the geometry of the main and the side channels. Especially the latter could help Rijkswaterstaat to minimize salt intrusion at locations relevant to freshwater intake, such as the Hollandsche IJssel.
Objective and Methods
The main objective of this thesis is to investigate how the geometry of the side and main channel influences the tidal phase difference between these two channels, and how this may impact the salt dispersion in the side channel. For this, we developed an analytical model describing harmonic wave propagation in multi-branch systems and used this next to results from a 3D numerical model for the Rhine Meuse Delta (RMM3D). We first systematically investigated the influence of changes in geometry and forcing for a network containing a single junction. Next, we determined the phase differences for the junctions with the Hollandsche IJssel and the Lek in the Rhine Meuse Delta based on the RMM 3D model. Subsequently, we model the Rhine Meuse Delta with the analytical model and use this to investigate possibilities to optimize the phase differences at these junctions to minimize salt intrusion.
Results
This research indicates that the geometric variables with the largest impact are the length and depth of the side channel. The length is important as it directly governs the reflection and potential resonance in the side channel. The depth is one of the main variables impacting friction, which determines if standing waves can form. The analytical model of the Rhine Meuse Delta showed it can adequately represent the current phase differences at the Hollandsche IJssel and the Lek. In addition, it can predict the sign and order of magnitude for changes in the geometry. The results show there are only limited possibilities to optimize the phase difference at the Hollandsche IJssel to further reduce salt intrusion. The current geometry of the Lek allows more significant changes to optimize the phase difference at this junction. For example, to increase the phase difference with 5° at the Hollandsche IJssel the length of the branch would need to be reduced by 10 km, compared to only 4 km at the Lek. A first estimate shows an increased phase difference can further limit salt intrusion, based on the salinity in the Nieuwe Maas.
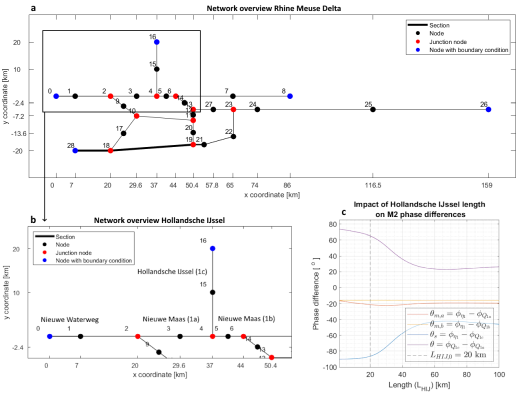
Figure 1: a) Overview of the Rhine Meuse Delta in the analytical model, and b) a more detailed overview of the junction with the Hollandsche IJssel. c) Phase differences between water level and discharge for each channel section connected to the junction with the Hollandsche IJssel (node 4 in panel a and b) as a function of the Hollandsche IJssel length. The phase difference influencing salt intrusion is given in purple as the phase difference between the discharge in the Hollandsche IJssel and the discharge in the Nieuwe Maas (1a); in orange the phase difference between water level and discharge of the Nieuwe Maas (1a); in yellow the phase difference between water level and discharge of the Nieuwe Maas (1b); in blue the phase difference between water level and discharge for the Hollandsche IJssel; and the dashed line shows the current length of the Hollandsche IJssel. The result shows that shortening the Hollandsche IJssel would increase the phase difference between the discharges. However, the effect is limited as the current length is in a region with a small slope coefficient.
References
Kuijper C., (2015), Analyse debiet- en zoutmetingen hollandsche ijssel. Report, Deltares.
Kuijper C., (2016), Analyse van de zoutmetingen in november 2015 langs de hollandsche ijssel. Report, Deltares.
Laan S., Chavarrias V., Huismans Y., and Van der Wijk R., (2021), Verzilting hollandsche ijssel en lek. Report, Deltares.
MacVean L. J. and Stacey M. T., (2011), Estuarine dispersion from tidal trapping: A new analytical framework. Estuaries and Coasts, 34(1):45–59.
Okubo A., (1973), Effect of shoreline irregularities on streamwise dispersion in estuaries and other embayments. Netherlands Journal of Sea Research, 6(1):213–224.
When and where to construct a sill to mitigate estuarine salt intrusion
G.G. Hendrickx1*, L.A. Manuel2, S.G. Pearson1, S.G.J Aarninkhof1, E.A. Meselhe2
1 Delft University of Technology, the Netherlands; 2 Tulane University, LA, United States of America
* Corresponding author: g.g.hendrickx@tudelft.nl
Introduction
At a global scale, estuaries are vital economic hubs, in part due to the combination of their access to inland regions via river systems with their proximity to sea. However, with the sea in close vicinity also comes the threat of freshwater contamination by saline seawater, especially during droughts. This study explores the potential of a mitigation measure to estuarine salt intrusion, namely the construction of a (temporary) earthen sill – a measure implemented in the Lower Mississippi River near New Orleans (LA, USA).
Objective and Methods
With the use of Delft3D Flexible Mesh, a sensitivity analysis on the design criteria for a sill has been investigated, with a focus on its effectiveness in mitigating estuarine salt intrusion. This analysis uses idealised estuarine morphologies in combination with 3D-simulations, and focuses on the stratified domain, i.e., salt wedge estuaries.
Results
The tidal range has a large impact on the effectiveness of the sill in mitigating salt intrusion (Figure): a large tide, the sill acts as a speed bump for the salt wedge propagating landward; a small tide, the landward-propagating salt wedge experiences the sill as a wall. In a microtidal estuary, the landward salt flux is dominated by the estuarine circulation, which cannot provide the leverage to push the salt wedge over the sill because it has to overcome its own driving force: gravity. In a macrotidal estuary, the tidal oscillation does provide the required momentum to push the salt wedge over the sill. Despite the sill being overspilled, the presence of the sill does reduce the salt intrusion in a macrotidal system, albeit less effectively than in a microtidal system. In both cases, the sill is most effective when it is approximately half the water depth in height.
Conclusion
A sill can be an effective measure to mitigate estuarine salt intrusion. The location and height of the sill largely determine the effectiveness as mitigation measure. Lastly, the sill is most effective in mitigating salt intrusion in microtidal systems, when salt transport is dominated by the estuarine circulation.
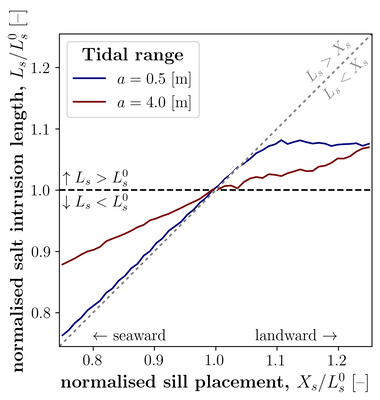
Salt intrusion length (Ls) versus sill placement (Xs) normalised by the salt intrusion length without a sill (Ls0). Sill placement is the distance of the sill from the estuary mouth. (Figure from Hendrickx et al., in review.)
References
Hendrickx, G.G., Manuel, L.A., Pearson, S.G., Aarninkhof, S.G.J., and Meselhe, E.A. (in review). An earthen sill as a measure to mitigate salt intrusion in estuaries. Submitted to Estuaries and Coasts [Nov. `23].
An experimental study on the effects of fixed banks on estuarine morphodynamics
E.W. Nota1*, L. Beyaard1 , M.G. Kleinhans1
1 Utrecht University, Netherlands
* Corresponding author: e.w.nota@uu.nl
Introduction
Many sandy estuaries around the world are characterized by multichannel networks and sandbars. The channels continuously shift due to tidal and river currents that drive complex sediment transport patterns and morphological change. This pose challenges to coastal safety and economically important shipping routes. Consequently, societies have interfered in many natural estuarine systems, for example with bank protection and dikes. This results in a complete or partial fixation of the estuarine planform, which affects the directions of flow and sediment transport and the space for channel migration. Alternating widening and narrowing around historic channel-bar complexes can topographically force bars, channels and scours into fixed positions (Leuven et al., 2018-a; 2018-b). Here, deep scour can be exacerbated by fixed banks, where steeper slopes can lead to shoal margin collapse, which also has consequences for bank and dike stability (van Dijk et al., 2018). This raises questions what degree of width variation causes topographic forcing, and how this affects channel scour.
Objective and Methods
Here we study the effects of fixed banks on estuarine morphodynamics by conducting scale experiments of sandy estuaries in the periodically tilting flume, the Metronome (Kleinhans et al., 2017). The 20 by 3 m Metronome is a flume that imposes tidal cycles by tilting with a period of 40 seconds, generating reversing shallow flow over a mobile sand bed, resulting in dynamic networks of channels and sandbars (Kleinhans et al. 2017). We ran up to 25.000 tidal cycles for three experimental setups of estuaries with varying planforms of fixed banks of rough industrial sandpaper, as well as a control run without fixed banks (Figure 1). At least one repeat experiment is conducted for each planform. Timelapse imagery was acquired at each tidal cycle from 7 overhead cameras and we periodically collect detailed orthophoto imagery (Figure 1) and Digital Elevation Models from a line laser scanner.
Results
For each of the studied configurations of fixed banks, we observe the emergence and persistence of topographically forced sandbars and channel scours that are consistent with repeat experiments. Forced sandbars can reach elevations above the fixed banks, whereas persistent channel scours can reach depths until the flume bottom. This is surprising for our setups with linearly converging dikes, as these planforms do not have the typical width variations that provide for constraints through which sandbars would not be able to migrate. Additionally, we distinguish quasi-periodic behaviour in the forming and disappearing of channels and sandbars that are not subject to topographic forcing. The periodicity of this behaviour is notably different between repeat experiments, implying that sediment transport in laboratory estuaries is a complex mechanism which is subject to variations in initial conditions. This could have consequences for our understanding of natural estuaries and our efforts to monitor and numerically model them.
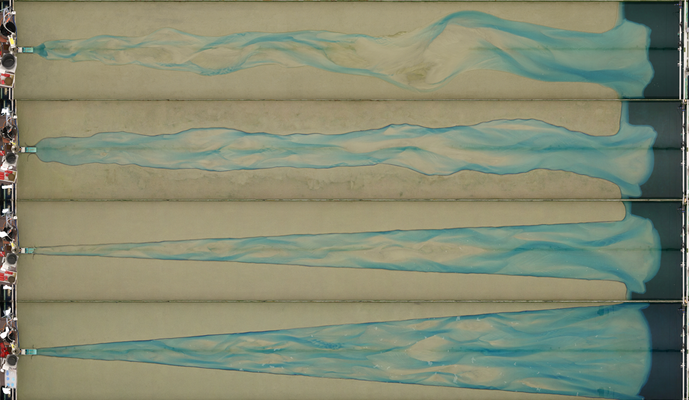
Figure 1. Orthophoto imagery of estuarine morphology in the Metronome at selected tidal cycles. The panels display the different bank configurations of the experiments conducted in this study.
References
Kleinhans, M. G., Van Der Vegt, M., Leuven, J., Braat, L., Markies, H., Simmelink, A., ... & Van Maarseveen, M. (2017). Turning the tide: Comparison of tidal flow by periodic sea level fluctuation and by periodic bed tilting in scaled landscape experiments of estuaries. Earth Surface Dynamics, 5(4), 731-756.
Leuven, J. R., Braat, L., van Dijk, W. M., de Haas, T., Van Onselen, E. P., Ruessink, B. G., & Kleinhans, M. G. (2018-a). Growing forced bars determine nonideal estuary planform. Journal of Geophysical Research: Earth Surface, 123(11), 2971-2992.
Leuven, J. R. F. W., De Haas, T., Braat, L., & Kleinhans, M. G. (2018-b). Topographic forcing of tidal sandbar patterns for irregular estuary planforms. Earth Surface Processes and Landforms, 43(1), 172-186.
Van Dijk, W. M., Mastbergen, D. R., van den Ham, G. A., Leuven, J. R., & Kleinhans, M. G. (2018). Location and probability of shoal margin collapses in a sandy estuary. Earth Surface Processes and Landforms, 43(11), 2342-2357.
Future sand dynamics in the Mekong Delta
A. Kwadijk1*, M. van der Vegt1 , M. van der Wegen2
1 Universiteit Utrecht, Netherlands; 2 Deltares, Netherlands
* Corresponding author: a.kwadijk@students.uu.nl
Introduction
As sand is a key building element of deltas, human interference with sand transport changes the delta. Local sand mining practises have already proven to be the main driver for morphological changes, including river bed lowering, resulting in accelerated loss of land and salinisation in the delta. Other morphological changes that contribute to these problems are delta-wide subsidence due to groundwater extraction and global sea level rise (SLR). Furthermore, upstream dam construction has resulted in a redistribution of discharge from the wet season to the dry season. How these anthropogenic perturbations in the deltas hydrodynamics and morphology alter the deltas internal sand dynamics remains a topic for ongoing debate.
Objective and Methods
This study aims to provide an overview on the projected changes on the deltas internal sand dynamics due to SLR, subsidence, river bed lowering and discharge alteration by dams. For this, a delta-wide DELFT3D-FM hydro- and morphological model is used. Simulations of one year were executed to test the systems response to SLR, subsidence, river bed lowering and an altered discharge separately. Furthermore, two scenarios for 2040 were investigated where projected changes for each perturbation were implemented collectively.
Results
Distinct responses for different hydrodynamic regimes were found:
- In the fluvial dominated regime seaward sand transport rates are highly variable along the river transect. Since dry season discharge is negligible compared to the wet season discharge, a reduction in the latter results in a reduced net import of sand annually. River bed lowering does not alter annual sand transport rates but increases the seasonality in sand transport.
- In the fluvial-tidal regime water depth increase as a result of river bed deepening causes an amplification of the tidal velocity amplitude. Consequently, seaward sand transport rates increase in this region and higher erosion rates can be expected.
- In the tide-dominated regime changes in discharge show little effect on sand transport rates. Due to the wide channels present in this region, an increase in water depth as a result of SLR, subsidence and river bed deepening results in a significant growth of the channels cross sectional area. This causes flow velocities and associated sand transport to decrease.
Since these regimes and anthropogenic perturbations are familiar for many other tidal deltas worldwide, the results of this study can act as an example on the expected morphological changes for other deltas worldwide.
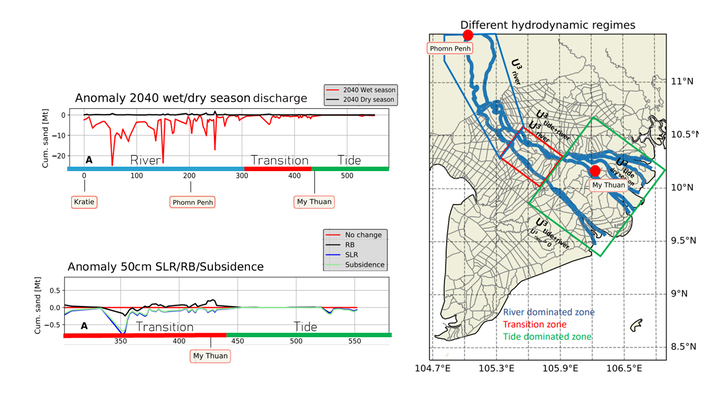
Upper left graph: Annual cumulative sand transport anomaly for an altered discharge due to upstream dam construction. Red indicates the wet and black the dry season along the main branch of the Mekong River. Lower left graph: Indicates anomalies in sand transport in the fluvial-tidal and tidal zone as a response to subsidence, SLR and river bed lowering (RB). Right figure: Indicates the different hydrodynamic regimes identified in the study area.
References
Eslami, S., Hoekstra, P., Minderhoud, P. S., Trung, N. N., Hoch, J. M., Sutanudjaja, E. H., Dung, D. D., Tho, T. Q., Voepel, H. E., Woillez, M. N., & van der Vegt, M. (2021). Projections of salt intru sion in a mega-delta under climatic and anthropogenic stressors. Communications Earth & Environment 2021 2:1, 2(1), 1–11. https://doi.org/10.1038/s43247-021-00208-5
Hackney,C.R.,Darby,S.E.,Parsons,D.R.,Leyland,J.,Best,J.L.,Aalto,R.,Nicholas,A.P.,&Houseago, R. C. (2020). River bank instability from unsustainable sand mining in the lower Mekong River. Nature Sustainability 2020 3:3, 3(3), 217–225. https://doi.org/10.1038/s41893-019 0455-3
Assessing Sea Level Rise Impact on Estuarine Morphodynamics
M. Reyes1*,M. Van der Wegen2 , J. Reyns3
1 IHE Delft, Netherlands; 2 IHE Delft, Netherlands; 3 IHE Delft, Netherlands
*mreyec@uni.pe
Introduction
Estuaries, where fresh water mixes with salt water under the influence of the tides, are home to a rich variety of marine life (IPCC, 2023). However, they face increasing vulnerability due to coastal development driven by climate change. Rising temperatures and sea levels have significantly affected estuaries, increasing their susceptibility to adverse outcomes. The Intergovernmental Panel on Climate Change (IPCC) reports highlight the sensitivity of estuaries and lagoons to these changes, which can lead to various adverse consequences. In order to develop a comprehensive study, it is crucial to understand the modelling challenges involved. Bamunawala et al. (2020) emphasize the importance of recognizing the complexity of the variables that impact the evolution of these challenges over time. In particular, the morphodynamic behavior of intertidal area under SLR scenarios remains a matter of concern and tools are needed to assess first order SLR impact when limited data are available.
Objective and Methods
The study examines the influence of sea level changes and sediment supply on estuarine morphodynamics in the light of climate change. The research applies the newly developed morQuest Matlab/Python code to assess SLR impact and comprehensively analyze morphodynamic responses for different estuaries along the US Westcoast. MorQuest was developed to make a first order morphodynamic assessment of estuaries under SLR in the absence of data required for more advanced modeling systems like ASMITA or Delft3D.
We carried out an extensive sensitivity analysis on model parameters, a calibration against historic data on the US Westcoast, and projections for SLR scenarios. In the sensitivity phase, we identify and prioritize the most sensitive model variables, focusing on the factors that govern sediment transport and distribution. During the calibration phase, we determine characteristic parameters of the area, with sea level rise being the main factor. Finally, a projection analysis predicted how rising sea levels would impact estuaries. By projecting these scenarios into the future, we gained valuable insights into how these crucial ecosystems respond to environmental changes. This knowledge informs adaptation and mitigation strategies. The morQuest code potentially emerges as a crucial tool for informed decision-making to sustain estuaries amidst changing environmental conditions.
Results
The study's findings offer an understanding of the dynamics shaping estuarine ecosystems along the U.S. West Coast in the face of climate change. Over the period from 1984 to 2016, notable trends emerged, including a decline in intertidal areas across several estuaries, albeit with exceptions such as the Coquille River and Nestucca Bay. Intriguing variations were observed, particularly in Siletz Bay, where, despite no significant changes in the intertidal area, a consistent decrease over time was noted, marked by the disappearance and emergence of the specific regions.
The morQuest model proved instrumental in assessing estuarine responses to climate change, particularly in identifying sensitive parameters and proposing resilience-enhancing strategies. Sensitivity analysis highlighted the crucial, but underexplored role of parameters related to the intertidal area width response to SLR. In contrast, uncertainty analysis underscored the importance of considering scenarios applicable to urbanized areas and the predominant influence of sea level rise on estuarine behavior. Projections suggest varying timelines for the loss of the intertidal regions across different estuaries, with Nehalem estuaries expected to be impacted within 50 years and others even sooner. However, uncertainties persist, particularly regarding sediment supply dynamics, necessitating further investigation for more robust management strategies in safeguarding these vital coastal ecosystems.
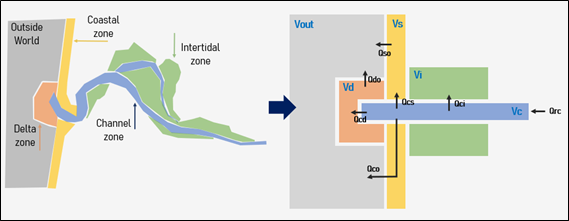
Scheme of elements inside of the morQuest Code.
References
- Bamunawala J, Dastgheib A, Ranasinghe R, van der Spek A, Maskey S, Murray AB, Duong TM, Barnard PLandSirisena TAJG (2020) A Holistic Modeling Approach to Project the Evolution of Inlet-Interrupted Coastlines Over the 21st Century. Frontiers in Marine Science 7 DOI 10.3389/fmars.2020.00542
- IPCC (2023) Climate Change 2021 – The Physical Science Basis: Working Group I Contribution to the Sixth Assessment Report of the Intergovernmental Panel on Climate Change Cambridge University Press, Cambridge.
XBeach modelling of storm sequence effects on dune erosion near Egmond aan Zee
M. Niemeijer1*, B. Van der Waal1, A. De Beer2, B. Grasmeijer1,2, L. Brakenhoff3, T. Price1
1Utrecht University, 2Deltares, 3Rijkswaterstaat
*Corresponding author: m.r.niemeijer@students.uu.nl
Introduction
Sandy beaches and dunes form the primary flood defences along a large part of the Dutch coast. To ensure sufficient resilience of the beach/dune system to erosion during intense storm conditions, flood risk management is tightly embedded in Dutch national law. Dune safety assessments are formulated in terms of the response to an individual (benchmark) storm occurring in isolation.
However, a storm event might lead to unexpectedly high levels of dune erosion if it occurs in a sequence of storms with insufficient time in between storms for the dune to fully recover. Most research in the field of coastal morphology tends to focus on the effects of single storms on beach morphology. There is relatively little research on the effects of storm sequences and the available literature often presents contradicting results [1]. Some studies report that the erosion potential of storms reduces over the duration of a sequence [2], suggesting that the beach tends to move towards equilibrium, while other studies found elevated erosion volumes for storms that were part of a sequence [3], suggesting that preceding storms destabilised the dune.
Objective and Methods
The aim of this study is to identify patterns in beach/dune behaviour to storms occurring in a sequence compared to storms occurring in isolation. In addition, effects of varying storm chronologies within a sequence are assessed. To achieve this, the morphological response of a 4 km beach stretch near Egmond aan Zee to a series of four storms was tested using a morphological numerical model. A measured storm group from early 2022 (with storms Corrie, Dudley, Eunice, Franklin) of one moderate (5-35 m3/m modelled erosion volume) and three weak storms (0-10 m3/m modelled erosion volume) was simulated using the numerical model XBeach.
The sequence was schematised in XBeach as a series of four storms, without any dune recovery between storms. The modelled dune erosion volume of sequences was compared against the observed dune erosion and the modelled cumulative dune erosion volume of the four individual storms.
Additional simulation runs were performed whereby at the end of each storm the bed level below the dune erosion surface was set back to the initial bed level in an attempt to reduce beach accretion, which was found to be overpredicted by Xbeach.
Results
Comparison of model results to observations showed a good prediction of the dune erosion pattern by XBeach. Sequence simulations with a continuously dynamic beach showed that the erosion potential of storm decreased as the sequence progressed. The total erosion volume of the sequence was approximately 15% less than the cumulative erosion volume of individual storms. Storm order variation did not significantly alter the predicted total erosion volume of a sequence.
The reduction of dune erosion of subsequent storms in a sequence was primarily due to increasing bed level elevation of the sub-aerial beach in the model, receiving an influx of sand from both the eroded duneface and the intertidal bar migrating onshore. The morphological response of the dune to the next storm varied locally, depending on the state of the beach. An eroded beach led to elevated dune erosion volumes by the next storm, while an accreted beach would stabilise the dune (see Figure).
Field measurements from Egmond show that the beach elevation tends to decrease rather than increase during storm conditions. Inter-storm bed level measurements are needed to relate the results of this study to real-world behaviour and to further calibrate the XBeach model for simulation of multiple storms.
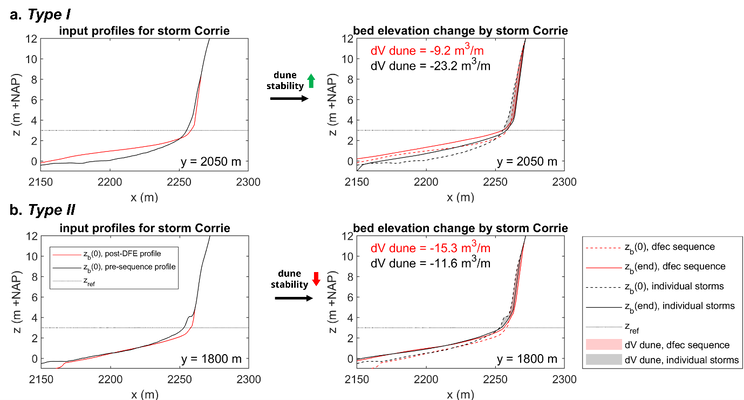
Example of two cross-sections where preceding storms had a different effect on dune stability. Bed level change caused by storm Corrie on two different initial profiles is compared. The black profile represents the measured pre-storm bed level (uneroded profile), the red profile represents the modelled bed elevation after storms Dudley, Eunice and Franklin (eroded profile). a.) Type I response: dune stabilisation by previous storms, more erosion on the uneroded profile. b.) Type II response: dune destabilisation by previous storms, more erosion on the eroded profile.
References
[1] Eichentopf, S., Karunarathna, H. & Alsina, J. M. (2019). Morphodynamics of sandy beaches under the influence of storm sequences: Current research status and future needs. Water Science and Engineering, 12 (3), 221-234. https://doi.org/10.1016/j.wse.2019.09.007 [2].
[2] Senechal, N., Castelle, B., Bryan, K.R. (2017). Storm clustering and beach response. In: Ciavola, P., Coco, G., eds., Coastal Storms: Processes and Impacts. Wiley Blackwell, Chichester, pp. 151e174. https://doi.org/10. 1002/9781118937099.ch8.
[3] Yates, M.L., Guza, R.T., O'Reilly, W.C. (2009). Equilibrium shoreline response: Observations and modeling. J. Geophys. Res.: Oceans 114, C09014. https://doi.org/10.1029/2009JC005359.
The role of turbidity in maintaining intertidal areas globally
T.J. Grandjean1,2*, R. Weenink1,2; D. van der Wal1,3, E.A. Addink2; Z. Hu4,5,6; S. Liu4; Z.B. Wang7,8; Y. Lin9,10; T.J. Bouma1,2
1 NIOZ, NL; 2 Utrecht University, NL; 3 University of Twente, NL; 4 Sun Yat-Sen University, CN; 5 Guangdong Provincial Key Laboratory of Marine Resources and Coastal Engineering, CN; 6 Pearl River Estuary Marine Ecosystem Research Station, CN; 7 Delft University of Technology, NL; 8 Deltares, NL; 9 SKLEC, CN;
10 Yangtze Delta Estuarine Wetland Ecosystem Observation and Research Station, CN
* Corresponding author: tim.grandjean@nioz.nl
Introduction
The balance of sediment supply and loss is critical for tidal flats to maintain, especially under future conditions with rising sea levels. Estuarine sediments may come from several sources, mainly rivers, the sea, primary production and shore erosion. Conversely, sediment loss primarily occurs through erosion by waves and tidal currents, which is often redistributed within the estuary. Changes in the balance may occur either through natural changes and global change-induced changes (e.g., increased storm events and droughts) or human activities (e.g., dam construction, dredging, and land use changes) (Giosan et al., 2014; Syvitski et al., 2009). In the end, insufficient sediment supply can lead to erosion and loss of essential ecological habitats such as tidal flats, salt marshes and mangroves (Mariotti & Fagherazzi, 2013). Further, this potential loss of intertidal areas poses a significant risk to the natural flood defence systems (Bouma et al., 2014), as their diminished capacity against storm surges and rising sea levels compromise coastal protection. While the critical role of sediment balance in maintaining tidal flats is acknowledged (Gao, 2019), empirical evidence is lacking to identify the minimum amount of sediment required to maintain under different conditions intertidal areas globally.
Objective and Methods
To identify the sediment thresholds essential to maintain intertidal areas, we quantified the morphological evolution of tidal flats over time and assessed the available sediment within estuarine systems globally. Recognising the absence of temporal datasets of sediment load and morphological development at global scales, we used Landsat 5 imagery to retrieve this information. Utilising 4,939 images, we constructed Digital Elevation Models (DEMs) for 40 estuaries, covering two distinct periods: 1986-1988 and 2009-2011. The DEMs allowed us to discern morphological changes within estuaries, offering insights into the trajectories in two dimensions: lateral (expanding or retreating) and vertical (accreting or eroding). Furthermore, we used satellite-derived turbidity (Dogliotti et al., 2015) as an accessible proxy for sediment availability worldwide. Based on these results, in combination with the tidal range data from tidal gauges, we identified a critical turbidity threshold crucial to maintaining estuarine tidal flats.
Results
While previous research has concentrated on the lateral changes of intertidal areas (Murray et al., 2019, 2022), our findings show that lateral changes do not invariably correspond to vertical alterations and vice versa. This discrepancy underscores the need to monitor morphological changes in both dimensions to understand estuarine dynamics. Moreover, the interconnectivity of intertidal habitats - such as salt marshes, mangroves, and tidal flats - plays a crucial role in morphological development; our study highlights the importance of including all intertidal habitats in analyses to determine a critical turbidity threshold. This resulted in our research identifying for the first time a tidal-amplitude-dependent turbidity threshold crucial for the existence of intertidal areas, providing new insights about the importance of managing turbidity levels in intertidal areas.
References
Bouma, T.J., van Belzen, J., … Herman, P.M.J. (2014). Identifying knowledge gaps hampering application of intertidal habitats in coastal protection: Opportunities & steps to take. Coastal Engineering, 87, 147–157.
Dogliotti, A.I., Ruddick, K.G., ... Knaeps, E. (2015). A single algorithm to retrieve turbidity from remotely-sensed data in all coastal and estuarine waters. Remote Sensing of Environment, 156, 157–168.
Gao, S. (2019). Geomorphology and Sedimentology of Tidal Flats. In Coastal Wetlands (pp. 359–381). Elsevier.
Giosan, L., Syvitski, J., Constantinescu, S., & Day, J. (2014). Climate change: Protect the world’s deltas. Nature, 516, 31–33.
Mariotti, G., & Fagherazzi, S. (2013). Critical width of tidal flats triggers marsh collapse in the absence of sea-level rise. Proceedings of the National Academy of Sciences, 110(14), 5353–5356.
Murray, N.J., Phinn, S.R., ... Fuller, R.A. (2019). The global distribution and trajectory of tidal flats. Nature, 565(7738), 222–225.
Murray, N.J., Worthington, ... Lyons, M.B. (2022). High-resolution mapping of losses and gains of Earth’s tidal wetlands. Science, 376(6594), 744–749.
Syvitski, J.P.M., Kettner, A.J., ... Nicholls, R.J. (2009). Sinking deltas due to human activities. Nature Geoscience, 2(10), 681–686.
Dutch asynchronous dune development due to the influence of beach pavilions
S.Vos1*, C van Ijzendoorn2, R. Lindenbergh1 and A. de Wulf3
1 Delft, University of Technology, The Netherlands; 2 Oregon State University, The United States; 3 Ghent University, Belgium
* Corresponding author: s.e.vos@tudelft.nl
Introduction
Coastal dunes provide an important role to Dutch society by fulfilling various ecosystem functions. These functions are under pressure because of climate change and urbanization. Dunes are mostly fed by shoreward aeolian sand transport. Increasing urbanization of the beaches in the last decades result in long term asynchronous dune development at certain locations due to the blockage of shoreward sand transport.
Objective and Methods
Three topographic datasets (vos et al., 2023) at various spatio-temporal scales were analyzed to study the effect of beach pavilions on local dune development at Noordwijk beach. First, on the smallest scale (order 100 meters and weeks) topographic changes around two sea containers at Noordwijk beach were studied with terrestrial laser scans. Second, the effect of a full size beach pavilion on the development of about 400 meters of dune was studied with a two year topographic dataset of (bi) monthly permanent laser scans (Kuschnerus et al., 2022). Third, 15 years of annual airborne lidar data along a 2.7-kilometer stretch of the beach/dune system in Noordwijk was used to evaluate the effect of 17 (semi)permanent beach pavilions on decadal dune development
Results
The sea containers experiment showed horseshoe-shaped deposition patterns developing on the leeside of the containers. These depositions followed daily wind changes and over the whole experiment left deposits corresponding to the mean wind direction over the measuring period. Similar patterns were found around the full size beach pavilion, but deposits caused by the wind are harder to distinguish from sand movements due to anthropogenic influences like bulldozing and beach shaping.
The evaluation of the longer termed dataset reveals large variations in dune height and volume in the neighborhood of beach pavilions. Changes in height/volume (Figure 1) vary between 1-8 meter in dune height increase and vary between 0-200 m3 in dune volume increase after 15 years along 2.7 km of coast. An autocorrelation analysis shows that the alongshore variability length scale in dune volume of urbanized dunes can be 10 times smaller than for natural dunes. For about half the beach pavilions, variations in dune height and volume are significantly correlated to the location of the beach pavilion. Here the growth behind the buildings is lower than in the surrounding area which can have consequences for long-term resilience.
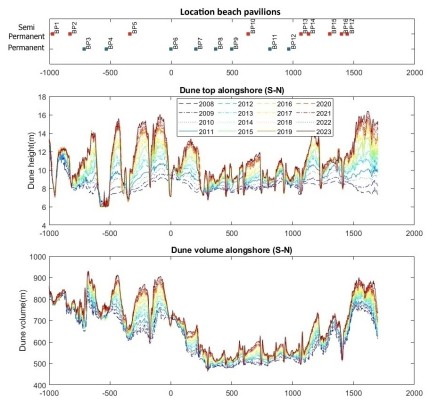
Figure 1: Dune development along the Noordwijk coast with (A) the alongshore locations of (semi) permanent beach pavilions, (B) the dune top height development from 2008 until 2023 with the locations of the beach pavilions as red/blue lines and (C) the dune volume development during the same period.
References
Vos, S., van IJzendoorn, C., Lindenbergh, R., de Wulf, A. (2023), Combined datasets for the article "Asynchronous dune development on a Dutch urbanized beach due to buildings and other anthropogenic influences". 4TU.ResearchData. https://data.4tu.nl/datasets/05477395-f4fe-46dc-bed9-89da04c0
Kuschnerus, M., Lindenbergh, R., Lodder, Q., Brand, E., and Vos, S. (2022) Detecting antrophogenic volume changes in cross sections of a seandy beach with permanent laser scanning, Int. Arch. Photogramm. Remote Sens. Spatial Inf. Sci., XLIII-B2-2022, 1055-1061, https://doi.org/10.5194/isprs-archives-XLIII-B2-2022-1055-2022, 20
Understanding Drivers of Sandy Beach-Dune Dynamics Through Permanent Laser Scanning
D.C. Hulskemper1*, K. Anders2, J.A.Á. Antolínez1 , R.C. Lindenbergh1
1 Delft University of Technology, The Netherlands; 2 Technical University of Munich, Germany
* Corresponding author: d.c.hulskemper@tudelft.nl
Introduction
Sandy beach-dune systems are among the most dynamic and complex coastal environments. Enhanced climate change will change the state of these systems, leading to probable disappearance of half of the world's sandy beaches (Vousdouskas et al., 2020). These systems are also directly influenced by human factors, such as the building of coastal structures, and modification of sediment flux (Mentaschi et al., 2018). These factors imply that extensive knowledge of how these systems behave, how we influence them, and how we could sustain them is essential but complex to obtain.
The impact of human drivers on sandy beach surface dynamics, particularly their contribution to dune development, has not yet been fully grasped and integrated into models. Moreover, the interaction between various natural drivers and patterns of surface dynamics over short time scales (days to months), remains not fully understood. A better comprehension of the drivers behind sediment transport between dunes and the sea is needed for more effective nourishment and reducing coastal squeeze (De Schipper et al., 2021).
Objective and Methods
This research, as part of the AdaptCoast project, aims to develop methods to detect, characterize, (inter)correlate, and predict types of human and naturally induced surface dynamics on a sandy beach. As first part of the research, datasets consisting of years of hourly point clouds of a beach are analyzed, acquired in permanent laser scanning setups in the Netherlands (Kijkduin and Noordwijk).
Short-term surface dynamics are automatically extracted as 4D objects-by-change (4D-OBCs, Anders et al., 2021). These thousands of surface activities are grouped and characterized (e.g., intertidal bar depositions, bulldozer work) using unsupervised clustering methods, namely a Self-organizing Map with subsequent hierarchical clustering. Then, various natural and human drivers (e.g., meteorological data) are compared to find possible correlation and causation.
Results
The workflow is already tested on the Kijkduin dataset, consisting of 6 months of hourly point clouds. Here it is shown that physically interpretable clusters of surface activity can be automatically extracted. For example, bulldozer work and intertidal bar deposition events are clearly grouped separately. When comparing the occurrences of these groups of surface activity to knowledge of natural and human drivers, correlations can be found. Clusters of bulldozer surface activities mostly occur in periods when the preparation for the summer season starts, whereas the destruction of intertidal bar surface activities coincides with storm conditions.
These results show that the workflow could enable long-term automated monitoring of surface activity in the complex sandy beach-dune systems. When applied on the more extensive dataset of Noordwijk (three years), more decisive correlations are expected to be found, as well as (intra)annual variability and their relation to larger scale development. This knowledge will be used to develop models for predicting surface dynamics, which should enable better measurement and management strategies on human influenced sandy beaches.
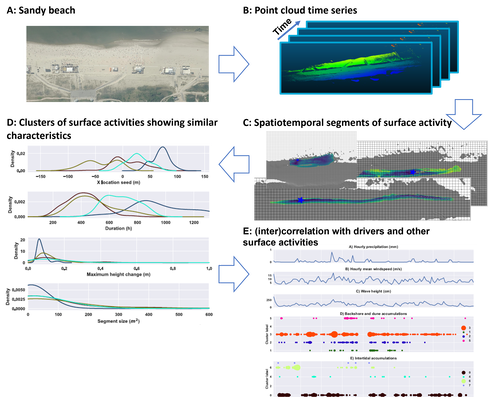
Graphical abstract of the research. From a point cloud time series (B) of a sandy beach, acquired using permanent laser scanning, spatiotemporal segments of surface activity (C) are extracted. These are grouped together using unsupervised clustering methods. From these clusters the characteristics of different types of surface activity (D, e.g., size, maximum height change, duration) can be obtained. After which the occurrence of types of surface activities over time can be analysed and compared to natural drivers and other types of surface activities (E). In E, every dot represents the initiation of surface activities. The colour represents the cluster to which the surface activities are assigned, and the size the number of initiations of this cluster at that point in time.
References
Anders, K., Winiwarter, L., Mara, H., Lindenbergh, R., Vos, S. E., & Höfle, B. (2021). Fully automatic spatiotemporal segmentation of 3D LiDAR time series for the extraction of natural surface changes. ISPRS Journal of Photogrammetry and Remote Sensing, 173, 297–308. https://doi.org/10.1016/J.ISPRSJPRS.2021.01.015
Mentaschi, L., Vousdoukas, M. I., Pekel, J. F., Voukouvalas, E., & Feyen, L. (2018). Global long-term observations of coastal erosion and accretion. Scientific Reports, 8(1). https://doi.org/10.1038/s41598-018-30904-w
de Schipper, M. A., Ludka, B. C., Raubenheimer, B., Luijendijk, A. P., & Schlacher, T. A. (2021). Beach nourishment has complex implications for the future of sandy shores. In Nature Reviews Earth and Environment (Vol. 2, Issue 1, pp. 70–84). Springer Nature. https://doi.org/10.1038/s43017-020-00109-9
Vousdoukas, M. I., Ranasinghe, R., Mentaschi, L., Plomaritis, T. A., Athanasiou, P., Luijendijk, A., & Feyen, L. (2020). Sandy coastlines under threat of erosion. In Nature Climate Change (Vol. 10, Issue 3). https://doi.org/10.1038/s41558-020-0697-0
Hybrid dunes: an international overview
D.W. Poppema1*, S. de Vries1 , A.J.H.M. Reniers1, A. Antonini1
1 Delft University of Technology, The Netherlands
* Corresponding author: d.w.poppema@tudelft.nl
Introduction
Globally, coastal defense strategies are increasingly integrating hybrid dunes, which meld sandy dunes with hard structures. These hybrid formations often intentionally merge traditional erosion-resistant materials like rocks and concrete with natural dunes. This approach aims to harness the benefits of both worlds: hard structures occupy less space and offer predictable performance, while sandy dunes provide recreational space, support biodiversity, and exhibit greater resilience to rising sea levels. Occasionally, hard structures like buildings or outfall pipelines are constructed in dune environments for different objectives, yet inadvertently alter erosion during storms.
When combining hard and soft elements, their stability and hydraulic response are no longer only a function of the classical behaviour of either individual hard or soft parts under wave action, but also of the complex feedback processes between dune morphology, wave attack and structural stability. These interactions, though poorly understood, are pivotal for designing new hybrid dunes and evaluating the effectiveness of existing hybrid defenses.
Objective and Methods
To better understand hybrid dunes, we aim to provide a structured overview of international hybrid dune cases, where sandy dunes provide coastal protection together with, or affected by, hard structures. This expands the definition of hybrid dunes beyond dunes with hard defensive constructions to include coastal dunes influenced by any hard structure, to consider both potential adverse and beneficial effects of such elements. The inventory categorizes hybrid dune cases based on the type of hard elements (e.g., revetment, geotube, building, road), the functions provided, synergies or drawbacks of the hybrid composition, positioning of the hard elements (e.g., behind, underneath, on top of the dune), and the sequence of development (e.g., constructed as a hybrid dune, hard structure added later, hard structure coincidentally present).
Characteristic or particularly notable types of hybrid dunes in the inventory will be examined to identify knowledge gaps and lessons learned on the design and safety assessment of hybrid dunes. This will be valuable for engineering practice in general, and also help us with the design of a unique field experiment that we are planning, in which an artificial full-size hybrid dune is to be constructed at the high-water line of the Sand Motor.
Results
An inventory of hybrid dunes around the world was collected (see figure). In Bay Head (New Jersey, USA), a relic rock seawall was covered by sand dunes. During hurricane Sandy, this forgotten seawall saved the hinterland from flooding (Walling et al., 2016). Similar hybrid constructions exist abroad. In Australia, the Gold Coast A-line seawall is likewise covered by dunes, but as part of the original design, to facilitate recreation while offering solid protection. The same principle is used at the Hondsbossche sea dike (NL), which was upgraded by constructing a dune landscape in front. Additional hybrid dune cases of various types can be found in the rest of the world, with the Netherlands and United States showing especially numerous examples.
Some valuable lessons are drawn from this overview. Hard structures built for coastal defense are often relatively large and alongshore uniform. Hereby, they tend to affect cross-shore sediment transport over a larger area. Other structures (buildings, outfall pipelines) usually have more local effects such as concentrated scour, potentially causing local weak spots in the dunes. During the NCK days, we will expand further on example cases and lesson learned.
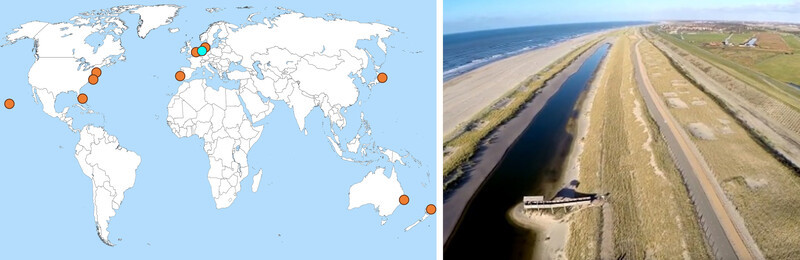
Left: a map of the hybrid dune cases in the inventory. Blue dot: the Hondsbossche Sea Dike, shown on the right
References
Walling, K., Herrington, T. O., & Miller, J. K. (2016). Hurricane Sandy damage comparison: Oceanfront houses protected by a beach and dune system with vs. without a rock seawall. Shore Beach, 84(3), 35-41.
Simulation of Wind Flow Speed-up over a Foredune Using Computational Fluid Dynamics
Saeb Faraji Gargari 1*, Derek Karssenberg1 , Gerben Ruessink1
1 Department of Physical Geography, Faculty of Geosciences, Utrecht University, The Netherlands
* Corresponding author: s.farajigargari@uu.nl
Introduction
Coastal dunes play an important role in preventing marine flooding, especially during storms, making it essential to investigate their formation and migration for effective hazard management strategies. Understanding the wind flow over dunes is pivotal in comprehending sediment transport, influencing the dunes' development and evolution over time. The interaction between dune geometry and wind velocity creates a mutual coupling effect. While experimental and field studies have explored the impact of wind velocity and dune geometry, they often face certain constraints. Numerical methods offer a viable solution, utilizing computational fluid dynamics (CFD) to simulate air flow by solving the governing equations. This study aims to investigate variations in near-bed wind speed and direction across a foredune, exploring how these changes are influenced by the direction of the inlet wind and geometric characteristics of the foredune, including its height and the stoss (i.e., seaward) slope.
Objective and Methods
Air flow was simulated over a coastal dune by solving the governing three-dimensional Navier-Stokes equations. OpenFOAM, an open-source code utilizing the finite volume method (FVM) to solve partial differential equations (PDEs), is employed for the wind flow simulation [1]. The CFD model was first evaluated through a comparison of its results with measured data [2] obtained from a roughly 15-meter high foredune (1:2 stoss slope) at Egmond aan Zee, the Netherlands. Subsequently, the model was applied to simulate wind flow over synthetic foredune profiles, with variations in foredune height ranging from 6 to 25 meters and stoss slope between 0.25 and 0.5. The investigation of wind flow over synthetic foredune profiles allows us to explore the impact of different geometric properties of the dune profile on the wind speed-up factor, that is, the ratio between the wind speed at the dune crest and the dune toe.
Results
To validate the CFD model, Fig. 1a displays the CFD model’s wind velocity speed-up factor from the crest to the toe of the foredune for various inlet wind directions ranging from 0 (dune normal) to 90 (alongshore) degrees. The model results are compared with measured data, demonstrating the accuracy of the CFD model. Fig. 1b illustrates the synthetic foredune profile, with foredune height (Hd varied to analyze its impact on the velocity speed-up factor. Fig. 1.c presents the speed-up factor from the crest to the toe of the synthetic foredune for different foredune heights and slope. The beach slope (S1) is 0.01, while the stoss foredune slope (S2) is set to 0.25 and 0.5. The findings indicate that speed-up increases with dune height and is largest for dune-normal wind. The speed-up is barely noticeable for dunes with a height of 6 m, while the speed-up can increase up to 11 for a dune with a height of 25 m and a slope of 0.5. Fig. 1c also shows that the stoss slope strongly affects the speed-up. According to the results, it is concluded that increasing both the dune's height and stoss slope amplifies the velocity speed-up.
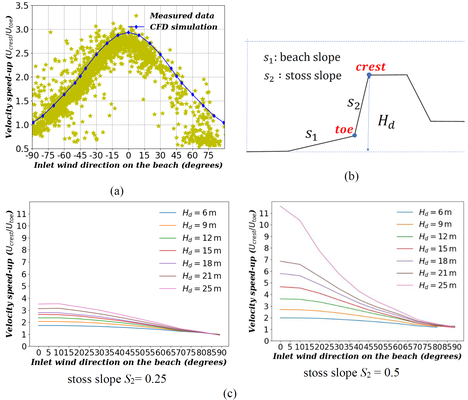
Figure 1. a) velocity speed-up factor (crest to toe) for CFD validation b) synthetic foredune profile c) Velocity speed-up factor for synthetic foredune considering different values of the stoss slope (S2).
References
[1] P.A. Hesp, T.A.G. Smyth, CFD flow dynamics over model scarps and slopes, Phys. Geogr. 42 (2021) 1–24. https://doi.org/10.1080/02723646.2019.1706215.
[2] C. Schwarz, C. van Starrenburg, J. Donker, G. Ruessink, Wind and Sand Transport Across a Vegetated Foredune Slope, J. Geophys. Res. Earth Surf. 126 (2021) 1–18. https://doi.org/10.1029/2020JF005732.
Towards modelling coastal dune and landform development for real-world applications using AeoLiS
B. van Westen*1,2, S. de Vries2, N. Cohn3, C.O. van IJzendoorn4, G. Strypsteen5, C. Hallin6
1Deltares, Boussinesqweg 1, Delft, 2629 HV, Netherlands
2Delft University of Technology, Department of Civil Engineering and Geosciences, Stevinweg 1, Delft, 2628 CN, Netherlands
3U.S. Army Engineer Research and Development Center, Coastal and Hydraulics Laboratory, 1261 Duck Road, Duck, NC, 27949, USA
4Oregon State University, College of Earth, Ocean, and Atmospheric Sciences, 101 SW 26th St., Corvallis, OR, 97331, USA
5Hydraulics and Geotechnics, Department of Civil Engineering, Bruges Campus, KULeuven, Spoorwegstraat 12, Bruges, 8200, Belgium
6Lund University, Faculty of Engineering, Division of Water Resources Engineering, Lund, Sweden
* Corresponding author: Bart.vanWesten@Deltares.nl
Introduction
Coastal dunes offer numerous societal and ecosystem services, such as enhancing flood protection, reducing sand nuisance on adjoining infrastructure, increasing natural and recreational value, and assisting in drinking water provision. The formation and evolution of coastal dunes result from a complex interplay of biophysical processes. Dune topography influences wind patterns, leading to variations in spatial shear stress and flow separation, steering landform development. In coastal environments, vegetation plays a crucial role in stabilizing dunes by reducing shear stress. Dune vegetation species like marram grass showcase a capacity for growth under conditions of high sediment deposition, enabling the stabilization of otherwise dynamic aeolian landforms. To effectively predict the development of coastal dunes, it is essential to utilize a suitable and user-friendly tool that accurately describes these processes. Current models provide valuable insights but face limitations in practical applications due to various constraints. For a tool to be effective in real-world engineering scenarios, it must be able to simulate dune-shaping processes across scales relevant to engineering – on a scale of kilometres and decades. This involves the ability to describe realistic environmental conditions, requiring flexibility in terms of boundary conditions and realistic topographies.
Objective and Methods
In this study, we aim to provide a predictive tool for dune development based on a comprehensive description of eco-physical processes, which can be used to inform decisions on how to intervene in coastal dunes. We use the AeoLiS sediment transport model, given its open-source availability and modular setup (de Vries et al., 2023). Previous iterations of AeoLiS primarily focussed on supply-limiting effects on aeolian transport, such as soil moisture and sediment sorting (Hoonhout & Vries, 2016; Hallin et al., 2023; IJzendoorn et al., 2023). Recent enhancements to the implementation of landform-shaping process, i.e. topographic steering and vegetation, have significantly improved computational efficiency and overall model robustness, and thus its applicability for predicting dune development.
To demonstrate the model's ability to predict the evolution of diverse aeolian landforms, we simulate four distinct dune types: Barchan dunes, parabolic dunes, embryo dunes, and the formation of blowouts; the latter being highlighted in this abstract. The blowout simulation draws on the observed evolution of five excavated notches in National Park Zuid-Kennemerland (Ruessink et al., 2018). For the model setup and validation, annual topographic data provided by Rijkswaterstaat is used. The wind conditions were derived from the ERA5 hindcast, chosen for its global coverage.
Results
AeoLiS successfully simulates the early stages of blowout formation in coastal foredunes over 10 years. The model reproduces the erosion patterns observed in the notches (Figure 1a-b), which is the result of a lack of vegetation cover and increased airflow through the blowouts (Figure 1d). In the simulation, the centre of each blowout undergoes significant erosion, reaching the presumed groundwater table, with the majority of erosion occurring along the erosional walls (Figure 1b). The model also captures the sediment deposition patterns landward of the notches. However, it predicts these deposits to be more concentrated and closer to the blowout sites than what is observed in actual measurements. A volumetric analysis reveals that the model estimates the erosion volume at ~127,000 m3, being a slight overestimation of 14% compared to the measured volume (Figure 1e). On the other hand, the model underestimates the amount of sediment transported from the beach to the backdune through the blowouts by about 60%.
Our study results show the ability of AeoLiS to predict several aspects of real-world blowout formation, in addition to barchan, parabolic and embryo dune development. This demonstrates its potential applicability to simulate real-world coastal dune development at engineering-relevant spatial and temporal scales.
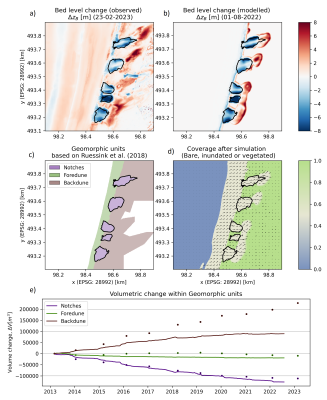
Figure 1. Overview of the development of five excavated notches at the National Park Zuid-Kennemerland. The observed (a) and modelled (b) bed level changes are compared in the upper panels. The sand coverage, water level, and vegetation cover at the end of the simulation are shown in d), together with arrows indicating wind flow, averaged over the last year. The volumetric changes within the different geomorphic units (c), based on Ruessink et al. (2018), are shown in the bottom panel (e).
References
Hallin, C., van IJzendoorn, C., Homberger, J. M., & de Vries, S. (2023). Simulating surface soil moisture on sandy beaches. Coastal Engineering, 185, 104376.
Hoonhout, B. M., & Vries, S. D. (2016). A process‐based model for aeolian sediment transport and spatiotemporal varying sediment availability. Journal of Geophysical Research: Earth Surface, 121(8), 1555-1575.
van IJzendoorn, C. O., Hallin, C., Reniers, A. J. H. M., & de Vries, S. (2023). Modeling Multi‐Fraction Coastal Aeolian Sediment Transport With Horizontal and Vertical Grain‐Size Variability. Journal of Geophysical Research: Earth Surface, 128(7), e2023JF007155
Ruessink, B. G., Arens, S. M., Kuipers, M., & Donker, J. J. A. (2018). Coastal dune dynamics in response to excavated foredune notches. Aeolian Research, 31, 3-17.
de Vries, S., Hallin, C., van IJzendoorn, C., van Westen, B., Cohn, N., Strypsteen, G., Skaden, J., Agrawal, N., & Garcia Alvarez, M. (2023). AeoLiS (Version 3.0.0.rc1) [Computer software]. Retrieved from https://github.com/openearth/aeolis-python
Mangrove-Sediment Connectivity in the Presence of Structures Used to Aid Restoration
N.R. Thillaigovindarasu1,2*, S.G. Pearson1, A. Gijón Mancheño1, A.J.H.M. Reniers1 and I. Gerritsma2
1 Delft University of Technology, The Netherlands; 2 Deltares, The Netherlands
* Corresponding author: raghavi.thillaigovindarasu@deltares.nl
Introduction
Mangrove forests are important wetland ecosystems that offer a diverse array of ecosystem services, including coastal protection and carbon sequestration (Spalding, 2010). Despite their significance, global mangrove cover has declined in recent decades, prompting various restoration initiatives, most of which often fail due to a lack of system understanding of the local mangrove habitat and associated physical and biological processes (Wodehouse and Rayment, 2019). A method gaining prominence involves the use of permeable dams to restore the sediment balance along eroding coastlines, thereby facilitating the restoration of mangroves in the area (Winterwerp et al., 2020). These dams help dissipate the approaching waves and reduce current magnitudes, thus creating a low energy environment behind them, ideal for sediment deposition. However, a comprehensive understanding of the system-wide implications of utilisation of permeable dams remains largely unexplored.
Objective and Methods
The study (Thillaigovindarasu, 2023) is focused on examining the response of a coastal system to structural presence, based on currents, waves and sediment and propagule pathways, to optimise restoration strategies. The coastline of Demak in Indonesia is chosen as the system to be modelled due to the persistent erosion problem in the region and the ongoing use of permeable and impermeable structures to mitigate the problem. A nested model was set-up in Delft3D-4 to estimate the flow hydrodynamics resulting from river discharge, tide and wind forcing in the area. Wave propagation in the region was also modelled using Delft3D-4 with a standalone nested wave model. Output from the hydrodynamic models served as input for the Lagrangian particle tracking model, SedTRAILS, to compute the sediment and propagule pathways.
Results
The hydrodynamic models demonstrate a decrease in both current magnitude and wave activity behind the structures, with a greater reduction observed in the case of impermeable structures. However, the radius of influence is constrained to less than a kilometre from the structures. The sediment pathways reveal reduced sediment movement behind the structures. However, the sediment imported due to the structures are sourced from within the intertidal basin which could trigger coastline retreat in the region. Additional tests reveal that impermeable structures, with a larger length-to-opening size ratio and, positioned closer to the mangrove fringe are more effective at retaining sediment. In case of propagules, the trapping behaviour of the structures is less apparent, with dependencies on the relative location of the structure to the sources and the direction of wind. In Demak, propagules approaching from the landward side of the structures become entrapped in the region behind the structures, thereby creating a possibility for mangrove restoration. The study concludes that coastal structures enhance sediment and propagule retention, with varying efficacy depending on the type, location and length of the structure, suggesting their potential utility as a valuable tool for mangrove restoration.
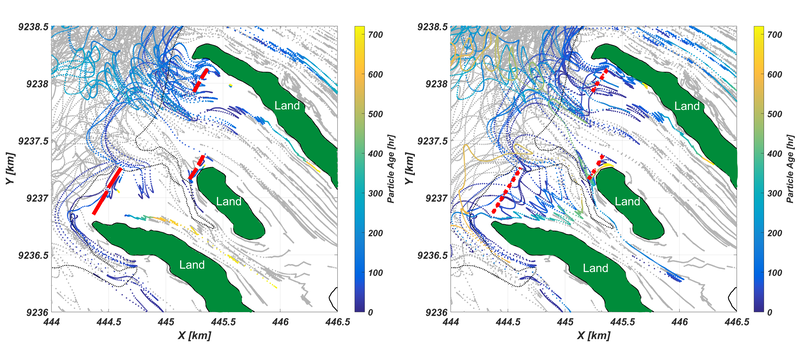
Figure 1: Sediment pathways in the presence of impermeable structures (left) and permeable dams (right). Sediment particles traversing through the area about half a kilometre behind the structures are mapped in colour according to their age (time elapsed since the particles were released), with the pathways of other sediment particles in the region in grey.
References
Spalding, M. (2010). World atlas of mangroves (1st ed.). Routeledge.
Thillaigovindarasu, R. (2023). Mangrove-Sediment Connectivity in the Presence of Structures Used to Aid Restoration: A Demak Case Study.
Winterwerp, J. C., Albers, T., Anthony, E. J., Friess, D. A., Gijón Mancheño, A., Moseley, K., Muhari, A., Naipal, S., Noordermeer, J., Oost, A., et al. (2020). Managing erosion of mangrove-mud coasts with permeable dams–lessons learned. Ecological Engineering, 158, 106078.
Wodehouse, D. C., & Rayment, M. B. (2019). Mangrove area and propagule number planting targets produce sub-optimal rehabilitation and afforestation outcomes. Estuarine, Coastal and Shelf Science, 222, 91–102.
Mapping Tools Transforming Blended Finance Options for Nature-Based Adaptation Measures
Ü.S.N.Best 1*, L. Bratt 1, A. Joling 1
1 Royal HaskoningDHV, The Netherlands
* Corresponding author: uwe.best@rhdhv.com
Introduction
Small Island Developing States (SIDS) face exceptional challenges due to their size, topography, and vulnerability to climate change driven impacts. These vulnerabilities necessitate innovative and sustainable nature-driven approaches to build resilience. Despite the economic, environmental, and social benefits they generate, investments in Nature-based solutions (NbS) projects remain limited: with a projected global financing gap exceeding $700 billion. The closure of this financing gap requires not only public financing and philanthropic funds, but it is imperative to attract private investors. Together with Van Oord, WWF Netherlands, Rabobank, SIWI, EcoShape and Conservation International- we utilize larger landscape plans of NbS investment options comprising both green and grey solutions to provide a strategic overview of project groupings.
Objective and Methods
We have utilized a cutting-edge approach—a Landscape Mapping Tool designed to enhance the understanding, planning, and financing of nature-based projects. With a focus on the SIDS region, we developed a Bonaire case study. This tool combines geospatial data, hazard vulnerability and ecological assessments, and financial overview to provide a holistic view of the potential impact and cost-effectiveness of NbS interventions. The hazard drive approach, which enhances our understanding of the baseline and future challenges for Bonaire, includes aspects such as sea-level rise and increasing of the (water) temperature and acidity, pluvial and fluvial flooding, storm surges and extreme wind, landslides, and anthropogenic influences. This interactive, web tool contains layers for population density, elevation and bathymetry, land use and inundation, which provide additional contextual data.
Results
The risk assessment layer identifies the direct and indirect damage relationships to quantify climate risk for each relevant hazard. For all hazard-asset combinations, direct damages were measured by vulnerability curves. The potential impacts and problems arising are mapped in full detail corresponding to the unique hazard, and this provides the basis for the nature based (green and grey) solutions for the island. Additional details relating to the bankability and funding sources are captured within the tool. The blended financing possibilities for sustainable projects are structured through green bonds /PP / loans, social bonds / PP / loans, and sustainable bonds / PP / loans.
This tool provides potential benefits towards closing the financial gap through enhanced stakeholder communication regarding natural capital solutions and specific financing strategies.
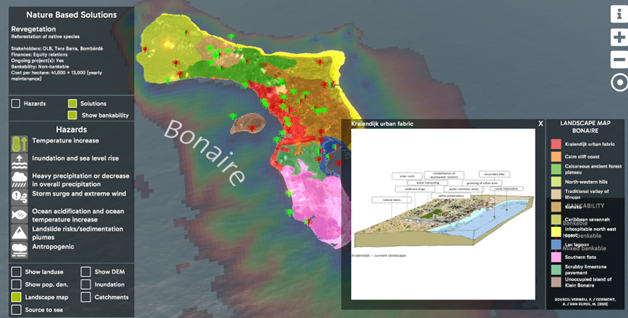
Interface for Bonaire Landscape Mapping Tool: Hazard assessment, solutions and bankability.
References
Colleen B. Bove, L. M. (2022). A century of warming on Caribbean reefs. Plos Clim. Retrieved from https://journals.plos.org/climate/article?id=10.1371/journal.pclm.0000002
EcoShape. (2021). Paving the way for scaling up investment in nature-based solutions along coasts and rivers. Retrieved from https://www.ecoshape.org/app/uploads/sites/2/2021/05/White-paper-Paving-the-way-for-scaling-up-nature-based-solutions.pdf
Matthijs van der Geest, E. M. (2020). Impact of terrestrial erosion on coral reef health at Bonaire: a plea for nature-inclusive “watershed-to-reef” based coastal management. Wageningen: Wageningen University & Research. Retrieved from https://www.dcbd.nl/sites/default/files/documents/impact_of_terrestrial_erosion_on_coral_reef_healt-wageningen_university_and_research_524688.pdf
Mücher, C. /. (2017). Elevation Bonaire. Retrieved from https://www.dcbd.nl/document/improved-aster-elevation-model-bonaire
Mücher, C. /. (2020). Land use map of Bonaire. Wageningen University & Research, Wageningen. Retrieved from https://www.dcbd.nl/document/land-use-map-bonaire
Pieter van Beukering, L. v. (2022). The Impacts of Climate Change on Bonaire. VU Amsterdam. Amsterdam: Institute for Environmental Studies. Retrieved from https://assets.vu.nl/d8b6f1f5-816c-005b-1dc1-e363dd7ce9a5/0973b67e-3084-4590-9a76-fa123436d113/IVM_R22-06_Synthesis%20Report%202022.pdf
Verweij, P. /.-W. (2020). Landscape map Bonaire. Wageningen University & Research, Wageningen. Retrieved from https://www.dcbd.nl/document/landscape-map-bonaire
WWF. (2020). Bankable nature solutions. WWF Bankable Blueprint Book. Retrieved from https://wwfint.awsassets.panda.org/downloads/bankable_nature_solutions_2__1.pdf
Quantifying wave impact reduction with a nature-based foreshore at the IJsselmeer dyke
V. Vuik1, M. Huis in 't Veld1 , M. Benit1, N. Tack2
1 HKV, The Netherlands; 2 HaskoningDHV Nederland BV , The Netherlands
*Corresponding author: nynke.tack@rhdhv.com
Introduction
Due to climate change, larger and more powerful storms are anticipated on the IJsselmeer. Therefore, the safety requirements are elevated, resulting in the necessity to reinforce the IJsselmeer dyke. During the exploration phase of this dike reinforcement multiple design options were considered including a foreshore to reduce wave-overtopping.
Studies and other projects, like the Houtribdijk and the Prinshendrik Zanddijk, have shown that a sandy foreshore nourishment can be an effective solution to reduce the wave impact on the primary barrier. In addition, foreshores contribute greatly to strengthening local biodiversity, which is crucial for a sustainable, future ecosystem. For the reinforcement of the IJsselmeer dyke a combination of a dam and foreshore was shown to be the preferred solution.
Objective and Methods
The objective of the study is to quantify the extent to which a combination of a dam and a natural foreshore can reduce the wave impact on the structures behind it, specifically in the case of the traditional IJsselmeer dyke.
The methodology used to quantify this impact consists of two steps. In the first step, the foreshore has been recreated in miniature during a physical wave flume test at Deltares. Three different configurations of the dam were tested, altering the structure and the height above the water surface. Additionally, the length of the foreshore was varied to determine its impact on wave head height. For each configuration, stability and several hydraulic loads were measured.
In step 2, the parameters from the wave flume test were utilized to determine the correction factors and uncertainties of the SWASH-wave model. This model was then employed to create new HRD databases, storing information about the influence of different foreshore designs on water height, wave height, period, and direction. By inputting these databases, the erosion and stability (GEBU/GEKB) modules were run, resulting in the final failure probabilities of the foreshore design.
Results
Our study demonstrates that integrating physical tests with modeling offers an effective approach for assessing the influence of nature-based foreshores on wave loads affecting defense structures. Key takeaways include:
- Stone Gradation and Height: Stone gradation and height significantly impact dam stability. We observed that the stability of stone gravels (ranging from 300-1,000 kg) in the topsoil depends on relative water depth compared to the crest level. Reducing stone gradation to 40-200 kg and 1-50 kg in the toe zone and inner foreshore, respectively, minimized damage. Dam height adjustments affected stability differently at the front and back.
- Foreshore Length and Water Level Changes: Foreshore length directly correlates with water level variations. Our tests on foreshores of 40, 60, and 100 meters revealed distinct water level rises. These variations depended on foreshore length and water depths. Longer foreshores led to greater energy dissipation and improved wave reduction.
- Failure Probability Assessment: Foreshore lengths between 40 and 120 meters meet water safety standards. Depending on dyke location, failure probabilities range from 1 in 61,224 years to 1 in 295,930 years.
These insights can inform future reinforcement projects, allowing informed comparisons between traditional and nature-based solutions.
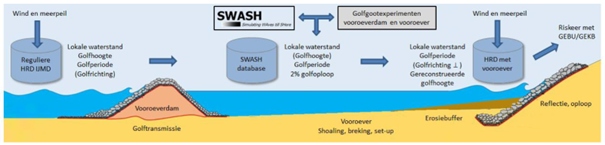
Schematic representation of the model train from base loads to local hydraulic loads, through the foreshore, to a failure probability calculation with the GEBU/GEKB module.
Spatial variation in Dutch Wadden Sea salt marshes and nature-based coastal flood protection by Living Dikes
E.B. Sipma1*, J.J. Warmink1, T.M. Duong1,2 and S.J.M.H. Hulscher1
1 University of Twente, The Netherlands; 2 IHE Delft, The Netherlands
*corresponding author: e.b.sipma@utwente.nl
Introduction
Climate change effects such as sea level rise and increased frequency and intensity of storms raise the need for reliable measures to provide continued safety from flooding at the coast. Space is limited for heightening or construction of conventional engineered dikes as they border populated areas, agricultural land or nature reserves. Furthermore, these kind of structures can act as a physical barrier that can lead to coastal squeeze and can act as an ecological barrier. Coastal wetland ecosystems, such as salt marshes, can serve as alternative, nature-based solution or foreshore in a Living Dike, that combines several beneficial ecosystem services with coastal flood protection. Salt marshes are tidally inundated ecosystems that are covered by salt-tolerant vegetation that can attenuate waves due to their shallower elevation and presence of vegetation. Furthermore, they have the ability to heighten with sea level rise by capturing sediment and can limit the occurrence of e.g. piping erosion and severity of flooding in a dike breach when fronting a dike (Zhu et al., 2020). However, as the dynamic nature of a salt marsh creates natural variation in space and development over time, it needs to be understood how to incorporate this into a reliable flood protection measure.
Objective and Methods
The aim of this study is to gain insight into the spatial variations that can occur for salt marshes and quantify the magnitudes of the variations that do occur. The focus here is on variations in bathymetry, with the plan to include variations in vegetation cover at a later point. For the bathymetry, elevation profiles of salt marshes along the mainland coast of the Dutch Wadden Sea and Ems-Dollard estuary (Harlingen-Nieuwe Statenzijl, about 170 km) are studied. These elevation profiles are taken from the bathymetric dataset referred to as ‘Vaklodingen’, which is collected by Rijkswaterstaat (part of the Dutch Ministry of Infrastructure and Environment) and has a spatial resolution of 20 m. The most recent measurement ‘sweep’ of 2015-2020 is used here. The elevation cross-sections are taken at a regular distance interval along the primary water defence (Nationale Basisbestanden Primaire Waterkeringen, Rijkswaterstaat), in either a fixed orientation or perpendicular to the dike transect. Every cross-section is categorized into salt marsh, tidal flat or neither, by using an ecotope map of the Dutch Wadden Sea (2017, Rijkswaterstaat). By analysing the cross-sections containing a salt marsh in front of the dike, a quantification of salt marsh bathymetry variation along the Wadden Sea coast is made.
Results
For the preliminary results, cross-sections with a spacing of 500 m along the dike transect are considered, with a fixed orientation of 320°. This orientation roughly corresponds to the northwest direction of incoming waves that one would expect to give the highest risk of flooding during an extreme storm. As an example, Figure 1 shows a part of the coastline considered, with elevation profiles of cross-sections for three distinct salt marsh sites displayed in subfigures. The part of the elevation profile categorised as salt marsh is coloured, with the colour matching where the cross-section occurs on the map. Only sites with a marsh width of at least 80 m are studied further, which is roughly 40% of the coastline considered. Preliminary quantification of the dimensions is done by making a linear least-squares fit through all salt marsh profiles. This yields an average elevation in between about 1.5 to 2 m above NAP, with a deviation from the linear profile of up to about 1.5 m. The average slope was found to often be very gentle, with a maximum of up to about 1:400. Furthermore, in many cross-sections there is a presence of human structures (e.g. summer dikes), which affects the salt marsh dimensions.
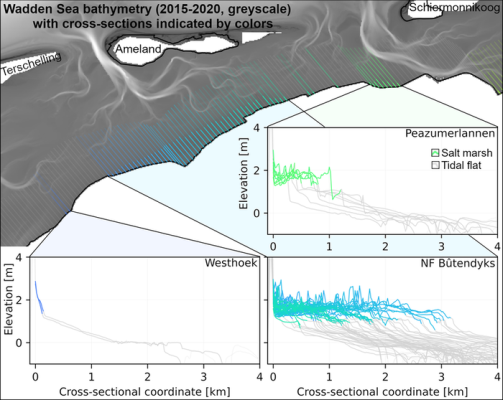
Figure 1 – (top) Bathymetry map of a section of the Friesian Wadden Sea coast, with cross-sections drawn every 500 m along the primary dike (orientation: 320°). Cross-sections containing a salt marsh are coloured, with the line becoming more transparent for the tidal flat and tidal channel. (subfigures) Elevation profiles along the cross-sections as indicated in the top figure for three salt marsh sites. Colours indicate the part of the profile categorised as salt marsh and correspond to the locations in the top figure, grey indicates tidal flat and tidal channel.
References
Zhu, Z., Vuik, V., Visser, P. J., Soens, T., van Wesenbeeck, B., van de Koppel, J., Jonkman, S. N., Temmerman, S., & Bouma, T. J. (2020). Historic storms and the hidden value of coastal wetlands for nature-based flood defence. Nature Sustainability, 3(10), 853–862. https://doi.org/10.1038/s41893-020-0556-z
The effectiveness of oyster reefs as a nature-based erosion control measure during storm events
Thijs van Steen1, Brenda Walles1, Jaco de Smit1 & Wietse van de Lageweg1
1HZ University of Applied Sciences, the Netherlands; 2 Organization Name, Country
*Corresponding author: wietse.van.de.lageweg@hz.nl
Introduction
Coastal ecosystems such as oyster reefs, salt marshes and mangroves are widely recognised as nature-based solutions reducing coastal erosion. Oyster reefs maintain their own habitat and have the ability to grow at the rate of sea level rise, making them self-sustainable, flexible and cost-effective coastal erosion measures in the face of climate change. By attenuating waves and stabilising sediment as well as facilitating and protecting neighbouring ecosystems, they stimulate coastal resilience. However, effective employment of oyster reefs as a nature-based erosion control measure is not trivial and requires the integration of ecological and engineering parameters.
Recent work demonstrates that oyster reefs lead to a four-fold reduction in erosion in the protected area compared to a non-protected area across a decadal period. Despite this apparent effectiveness across a longer time period, it is still poorly understood how effective oyster reefs are in reducing erosion during individual storm events and how large their morphological footprint during these events is.
Objective and Methods
We present the findings of a series of detailed morphological field surveys of the Viane oyster reef (200m x 8m x 0.25m) in the Eastern Scheldt, the Netherlands, during which three storm events (Ciaran, Pia and Henk) were captured. These storms led locally to significant wave heights of 1.3-1.5 m, corresponding to the highest percentile of wave events recorded locally. Monthly surveys with a LEICA dGPS were performed to assess the elevation changes pre- and post these storm events along four transects. Three transects crossed the oyster reef (west, middle, east) and one served as a reference transect without an oyster reef. The transects aligned with Rijkswaterstaat RTK monitoring to allow for a comparison with the longer-term historical trends and had a total length of 500 meters.
Results
Results show that storm Ciaran resulted in a transect-average erosion of 0.02-0.05 m for the unprotected areas, corresponding to the typical annual erosion for the intertidal flats of this area. In contrast, the reef-protected areas showed a greatly reduced erosion of maximum 0.02 m but typically 0.01 m. It is important to note that the erosion pattern as a result of this storm event is far from homogeneous: erosion is greatest immediately behind the reef (~first 50 m), then reduces up to 150 m behind the reef, followed by a zone of deposition (150-250 m behind the reef) and then transitions into another zone of erosion (250-450 m behind the reef). Storms Pia and Henk had a notably smaller morphological effect on the Viane tidal flats, independent of the presence of the oyster reef. Although the maximum wave heights of these storms were of similar order of magnitude as observed for storm Ciaran, the wave directions were west rather than south. Complementary numerical modelling with XBeach will be used to obtain additional insights into the role of wave angle, wave period and tidal timing on the flow, sediment transport and morphological changes caused by the Viane reef structure during storm events.
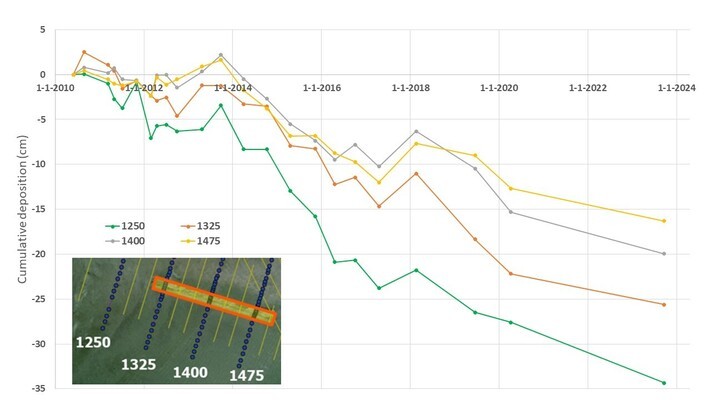
Figure 1. Cumulative deposition for four transects of the Viane (Eastern Scheldt) tidal flat with (transects 1325, 1400, 1475) and without (transect 1250) protection by an oyster reef during the period 2010 - 2023.
Modelling Airflow in Foredune Blowouts Using Computational Fluid Dynamics
Jim Regtien1*, Saeb Faraji Gargari1, Michiel van den Broeke1 and Gerben Ruessink1
1Utrecht University
* Corresponding author: j.regtien@students.uu.nl
Introduction
For decades, coastal managers have attempted to stabilize the foredunes as much as possible, turning them into uniform, densely vegetated ridges. While this strategy has been successful at encouraging growth of the foredune, it has also stopped sand input from the beach to the backdunes. This could potentially worsen future flood risk, as the dunes are now prevented from growing with sea level rise. Furthermore, this lack of sand input, amongst other factors, has negatively affected the biodiversity in the backdunes.
Foredune blowouts have been proposed as a solution to these problems, as they can facilitate landward sand transport for deposition onto the backdunes. Field experiments where notches, which can be seen as the anthropogenic equivalent of blowouts, have been dug into the foredune have shown positive effects on the total landward sediment budget. The local wind field is the controlling factor for how efficiently sand is transported to the backdunes, and, as this is mostly determined by secondary flow (i.e. interactions with topography), the question remains: what is the optimal notch geometry for encouraging long-term sand input to the backdunes?
Objective and Methods
We aim to investigate how the geometry of a foredune notch controls the local wind field. In order to do this, we first examine existing wind measurements in a notch in Dutch National Park Zuid-Kennemerland. This site and data also serve as a test case for our computational fluid dynamics (CFD) model. In the future, we plan to find the ‘optimal’ notch geometry by running simulations with ‘synthetic’ notches, in which we systematically vary notch geometry (e.g., width at seaward side, perimeter, slope of the notch floor).
We model the airflow in a foredune notch at the Zuid-Kennemerland area, the Netherlands using CFD. The dimensions of this blowout are 110 m (along-shore) x 250 m (cross-shore) x 10 m (height) [1]. Inside this blowout, four sonic anemometers were placed in 2017 and 2018 at the seaward notch entrance (SA 1), inside the through of the blowout (SA 2 & 3) and on the depositional lobe (deposit of sediment located at the terminus of a blowout, SA 4).
The wind field is modeled using the opensource CFD software package openFOAM [2]. The model is evaluated against measurements obtained with the sonic anemometers in order to show that it can accurately reproduce the wind field.
Results
Blowouts have a significant topographic forcing effect on the wind field (i.e. modulate the flow velocity). In figure 1A, the wind speed as measured by the SAs is shown. If wind blows into the blowouts entrance (incident wind from -50 to 50 degrees), a gradual acceleration is observed from SA 1 to 3. At the depositional lobe, a deceleration compared to the previous SA is observed. This is caused by the lateral walls acting as a ‘funnel’ for the wind.
Inside the blowout, the wind is gradually redirected into a direction that is parallel to the blowouts long axis. Figure 1b illustrates this: at SA 1, the wind blows still in a similar direction to the incident wind. At SA2, the wind is already steered somewhat to be more oriented along the blowout axis. At SA 3, the wind only deviates very slightly from the blowout axis, no matter what direction the wind comes from.
On figure 1A and B, the model output is also shown. The model agrees with the measurements to a high degree, leading us to conclude that it reproduces the wind field and is suitable to investigate the impact of notch geometry on wind flow.
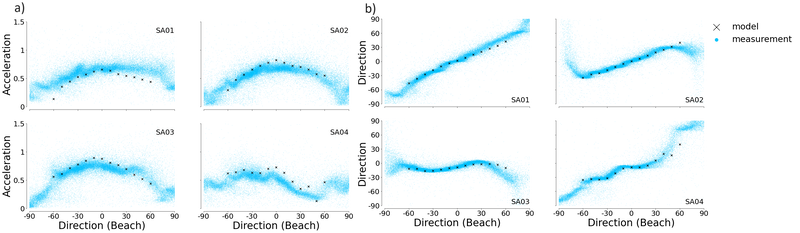
Figure 1: a) shows the wind velocity at every sonic anemometer (blue dots) for incident wind directions from -90 to 90 degrees and model output (black crosses) for incident wind directions from -60 to 60 degrees. b) shows the measured wind direction at the SAs. The directions are all relative to the blowout axis. The wind speed is normalized to the 10m wind measured at the weather station in IJmuiden. This station is located only 2km away from our study site and thus, the measurements by this station were seen as representative of the wind at the beach.
References
[1] B.G. Ruessink, S.M. Arens, M. Kuipers, J.J.A. Donker, Coastal dune dynamics in response to excavated foredune notches, Aeolian Research, Volume 31, Part A, 2018, Pages 3-17, ISSN 1875-9637, https://doi.org/10.1016/j.aeolia.2017.07.002.
[2] Thomas A.G. Smyth, A review of Computational Fluid Dynamics (CFD) airflow modelling over aeolian landforms, Aeolian Research, Volume 22, 2016, Pages 153-164, ISSN 1875-9637, https://doi.org/10.1016/j.aeolia.2016.07.003.
Quantification of the Dune Retreat and Eroded Volume: Case in Culatra, Algarve, Portugal during Storm Xynthia 2010
Dabu, R. E.1*, Ferreira, O.1, Y. Garzon, J1.
1 University of Algarve, Portugal;
* Corresponding author: a81919@ualg.pt
Introduction
Dunes provide coastal protection against flooding and erosion to the barrier island, mainland, and back-barrier behind it. To maximize this coastal protection, understanding the alongshore variability of dune response to storms is essential. The primary factors affecting this longshore variability, as identified by Garzon et al., 2021, are initial morphology (beach and foreshore), wave energy and incidence angle, dune morphology and hydrodynamics and vegetation. Field data such as (i) Lidar Survey 2009 and (ii) Lidar Survey 2011 are used to quantify the dune retreat and eroded volume due to Storm Xynthia 2010.
Objective and Methods
The objective is to quantify dune retreat and eroded volume from field data. The analysis of Lidar data from 2009 and 2011 encompasses several key components. Firstly, it involves identifying mega cusp and dune distance from the shoreline, a task conducted through QGIS. The start of vegetation was assumed as the marker for the dune's foot, with orthophoto maps providing supplementary insights. Secondly, the quantification of dune retreat and volume change post-storms is undertaken. This process entails generating grids of uniform spacing and subsequently computing vertical differentials to gauge alterations in volume.
Results
The profiles were examined and subsequently, the net eroded volume and elevation changes were calculated.
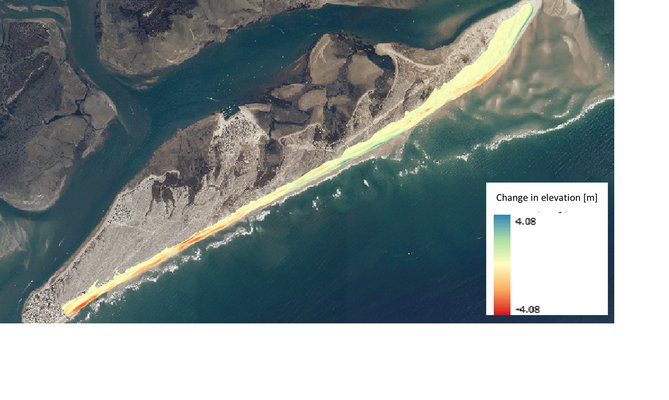
Change in elevation covering dune and beach
The effect of nourishments on dune erosion during a storm sequence
Bart van der Waal1*, Merijn Niemeijer1, Anne de Beer2, Bart Grasmeijer1,2, Laura Brakenhoff3, Timothy Price1
1Utrecht University, 2Deltares, 3Rijkswaterstaat
* Corresponding author: j.b.vanderwaal@students.uu.nl
Introduction
The Dutch coast is one of the most heavily nourished coasts in the world, with ~12 Mm3 of sand being added to the coastal system annually (Brand et al., 2022) to combat chronic coastal erosion. This is necessary to ensure flood safety for the hinterland, by maintaining the nearly uninterrupted sandy beaches and, in particular, wind-blown dunes. The long-term effects of local nourishments on beach-dune development and dune erosion volumes during storms, however, remain unclear. Besides feeding the coast with sand, beach nourishments and shoreface nourishments may both act as direct buffers against dune erosion during storms. Although both types of nourishments remain present over multiple (4 -10) years (Brand et al., 2022), during which multiple storms may pass, their cumulative effect on dune erosion rates remains unknown. Moreover, sequences of storms during a single storm season may lead to different responses of the beach-dune system, compared to a non-nourished stretch of coast. In turn, this could affect the time windows for post-storm recovery (Eichentopf et al., 2019), potentially giving rise to alongshore variations in beach-dune development.
Objective and Methods
The objective of this study is to provide insight into the effect of nourishments on dune erosion during a storm sequence, in particular the difference between a nourished and non-nourished stretch of coast (sub-aim 1) and the protective effect of various nourishment designs (sub-aim 2). For this, the numerical model XBeach (Roelvink et al., 2015) was used to simulate hydrodynamic and morphodynamic responses during a storm sequence at Egmond aan Zee, the Netherlands. For this study, offshore hydrodynamic data measured during a sequence of storms in early 2022 (with storms Corrie, Dudley, Eunice, and Franklin) were used as input for the model. Six measured bathymetries from 2020 – 2023, each spanning 6 km alongshore with a nourished and non-nourished section of coast, were utilized to investigate potential persistent effects of nourishments on dune erosion during the storm sequence (sub-aim 1). Additionally, different nourishment designs were added to the most recently acquired bathymetry October 2023 to investigate the effects of nourishment design on dune erosion (sub-aim 2). Configurations included the actual design of the 2023-2024 Bergen-Egmond shoreface nourishment, various beach nourishments, and the removal of the outer subtidal bar.
Results
The results showed a decrease in dune erosion during the storm sequence in the nourished site compared to the non-nourished site for the bathymetries from 2020-2023, attributed to increased wave dissipation over the shallower and further onshore-positioned subtidal bars in the nourished site. Alongshore spatial variability of dune erosion strongly correlated with the beach slope, where steeper beach sections lead to more dune erosion. Furthermore, a persistent erosional hotspot in the non-nourished site corresponds to the alongshore location of a deeper area (up to -6 m) in the nearshore bathymetry, where short waves propagate further onshore before breaking. The addition of various shoreface nourishment designs results in limited impact on dune erosion rates during the storm sequence, suggesting that shoreface nourishment effects on dune erosion develop over timescales longer than that of a single storm season. Conversely, beach nourishment designs have a more direct impact on dune erosion volumes since the entire beach and the height of the dune toe are raised. In conclusion, our findings indicate that nourishments can decrease dune erosion rates, by altering the foreshore and beach morphology and thus increasing wave dissipation. This helps with safeguarding the coast against flooding, during a storm sequence.
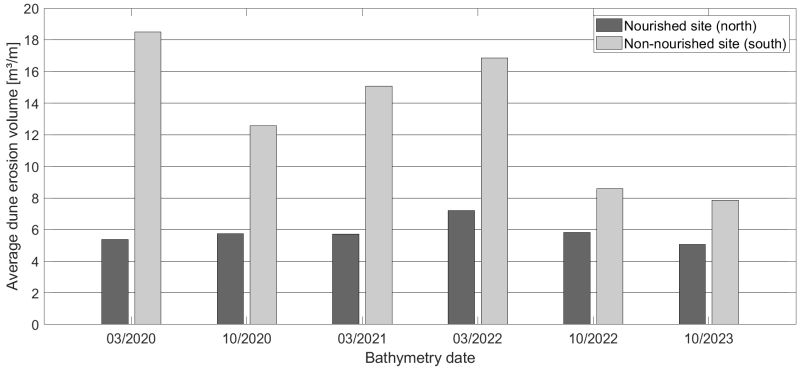
Average dune erosion volume for the nourished and non-nourished site per bathymetry. References
References
E. Brand, G. Ramaekers, and Q. Lodder. Dutch experience with sand nourishments for dynamic coastline conservation–an operational overview. Ocean & Coastal Management, 217:106008, 2022. doi:https://doi.org/10.1016/j.ocecoaman.2021.106008.
S. Eichentopf, H. Karunarathna, and J. M. Alsina. Morphodynamics of sandy beaches under the influence of storm sequences: Current research status and fu[1]ture needs. Water Science and Engineering, 12(3):221–234, 2019. ISSN 1674-2370. doi:https://doi.org/10.1016/j.wse.2019.09.007.
D. J. Roelvink, A. van Dongeren, R. McCall, B. Hoonhout, A. van Rooijen, P. van Geer, L. de Vet, K. Nederhoff, and E. Quataert. Xbeach technical reference: Kingsday release. 04 2015. doi:10.13140/RG.2.1.4025.6244.
Morphological boundary conditions for increasing barrier island dynamics: the case of Schiermonnikoog
A. Kroon1,2*, L. Spaans1 , B. van Leeuwen1, Y. Attema1 and K. van der Giessen3
1 Svašek Hydraulics, The Netherlands; 2 Delft University of Technology, The Netherlands; 3 Wetterskyp Fryslân, The Netherlands
* Corresponding author: kroon@svasek.com
Introduction
Developed barrier islands are likely to drown due to anthropogenic activities that reduce overwash delivery and the landward extent of overwash (Rogers et al., 2015). On the Dutch barrier islands sand-drift dike development has been common in recent decades. The practice has reduced sediment mobility and overwash delivery (Oost et al., 2012). The resulting accelerated succession of vegetation in the hinter-lying salt marsh prevents the supply of fines from the back-barrier basin and finally leads to a relative deepening of the barrier island (Bakker et al., 2023).
Coastal managers' awareness of these issues is rapidly increasing, and (partial) removal of the sand-drift dikes is under consideration at multiple locations. One example is the Dutch barrier island Schiermonnikoog, where the inundation risk is higher than allowed according to Dutch standards. The drafting of reinforcement plans started in 2022. These plans aim to enhance the long-term resilience of the island, and may entail the (partial) removal of the sand-drift dike to create dune notches or an overwash complex.
Whether such activities can lead to the desired increase in sediment dynamics will depend on the ambient morphological trend (Arens, 2022), with higher dynamics observed at eroding coasts.
Objective and Methods
This study aims to map the morphological trend of the North Sea coast of Schiermonnikoog to assess the feasibility of stimulating the dynamics and resilience of the island against sea level rise. To this end we analyzed dune volume, beach width and shoreline position trends using the Jarkus Analysis Toolbox (Van IJzendoorn, 2021). These trends are given a physical context using a visual cross-shore analysis.
The trends are analyzed in three sections. These sections are respectively from west to east: 1) the head of the island "Eilandkop", which is most significantly affected by the behaviour of the ebb-delta; 2) the "Oosterduinen", a natural dune system with multiple dune rows with a Northern orientation and 3) the most eastern section, the sand-drift dike "Stuifdijk".
Results
The morphological development on Schiermonnikoog is dominated by the periodic landing and spreading of large volumes of sand from the ebb-delta. During the last landing of a sand bar from the ebb-delta (1990s), the beach width significantly increased, and a green beach formed on Schiermonnikoog. The vegetation on the green beach captures sediment and thus prevents further aeolian transport to the dunes, Fig. 1. Especially at the Eilandkop, the beach is too wide for marine processes affecting the dunes, and the dynamics are low. The start of a new landing of sand from the ebb-delta is can be observed at the Oosterduinen, which is will probably increase the beach width especially at the Eilandkop before dynamics can start to increase.
Therefore, the chances of increasing dynamics seem to be highest for the Stuifdijk. A recent eroding trend in volume and beach width is observed. Parts of the embryonic dunes and the green beach have eroded. Continuation of this trend will naturally increase dynamics in the first dune rows or beyond. Therefore, acceleration of this process by constructing a notch or a washover at this location is under considation. Hopefully, this will increase the islands' resilience to rising sea levels.
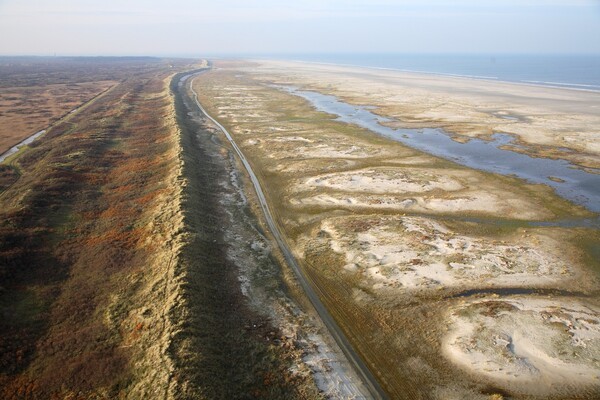
Figure 1: Aerial image of Schiermonnikoog with from left to right the salt marsh, the sand-drift-dike, the green beach, the sandy beach and the North sea (source: Beeldbank Rijkswaterstaat, Joop den Houdt).
References
Arens, B., Bos, B., Damsma, P., Geelen, L., Goessen, P., Graaf, S. van der, Groenendijk, D., Harkema, E., Heide, T. van der, IJff, S., Janssen, M., Kooijman, A., Lamers, J., Meij, T. de, Meijer, J., Nachbar, N., Nijenhuis, M., Oost, A., Prins, M., Roeland, E., Rossenaar, A.-J., Smit, G.-J., Spek, E. van der, Terlouw, S., Valk, B. van der, Wijk, K. van, Zijlstra, A. (2022). Handleiding Dynamisering Zeereep, Versie 1.0.
Bakker, Berg, Grootjans, Olff, Schrama, Reijers, Van der Heide, (2023). Biogeomorphological aspects of a model barrier island and its surroundings - Interactions between abiotic conditions and biota shaping the tidal and terrestrial landscape: A synthesis, Ocean & Coastal Management, 239, 106624.
Oost, Hoekstra, Wiersma, Flemming, Lammerts, Pejrup, Hofstede, van der Valk, Kiden, Bartholdy, van der Berg, Vos, de Vries, Wang, (2012). Barrier island management: Lessons from the past and directions for the future, Ocean & Coastal Management, 68, 2012, 18-38.
Rogers, Moore, Goldstein, Hein, Lorenzo-Trueba, and Ashton (2015). Anthropogenic controls on overwash deposition: Evidence and consequences, J. Geophys. Res. Earth Surf., 120, 2609–2624.
Van IJzendoorn, (2021). Jarkus Analysis Toolbox, https://github.com/christavanijzendoorn/JAT
Quick Reaction Force Egmond aan Zee: Measurements of alongshore-variable dune erosion and hydrodynamics during storm seasons
T.D. Price1*, B.T. Grasmeijer1,2, L. Brakenhoff3, M.C.G. van Maarseveen1, H. Markies1
1 Utrecht University, The Netherlands; 2 Deltares, The Netherlands; 3 Rijkswaterstaat, The Netherlands
* Corresponding author: t.d.price@uu.nl
Introduction
On the Dutch coast, dune erosion is most common during heavy storms from the north-west, characterised by large waves and high surge levels. The volume of eroded dune sand and mode of foredune erosion following such storms has been observed to vary strongly alongshore. Although such variations have been related to alongshore-variable pre-storm (bio)geomorphology of the bar-beach-dune system, the question remains how these alongshore variabilities develop and persist over multiple storms and storm seasons. After a storm, sand slowly returns to the beach-dune system during prolonged periods of lower wave energy, until the next storm arrives. If storms follow each other up without sufficient time for the beach-dune system to recover, the effect of a single storm within such a sequence may be larger than when it occurs as an isolated storm. With this project, we aim to quantify and unravel the effect of storm sequences for the (long-term) development of the sandy bar-beach-dune system at Egmond aan Zee, using a combination of long-term monitoring and a Quick Reaction Force (QRF) to acquire measurements of dune response and the nearshore wave field during storms.
Objective and Methods
During the storm seasons (October – March) of 2017/2018 – 2023/2024 we deployed 7 pressure sensors spaced 250 m apart, along a 2 – 5 km stretch of beach south of Egmond aan Zee. All sensors were located above the high tide water level, each at different elevation levels (maximum 1 m difference). We monitored marine forecasts for approaching storms and deployed additional pressure sensors before the storm surge arrived. During the study period the sensors were submerged several times during storm surges of 1-2 m. Full bathymetric (sonar-equipped jetski) and topographic (mobile laser scanner) surveys were done at the start and end of the storm season, and additional topographic surveys of the beach and dune were performed directly before and after storms, to capture the impact of individual storms. Regular (every 2 - 4 months) topographic surveys and aerial photographs of a 6 – 10 km stretch of coast at Egmond aan Zee (Ruessink et al., 2019) provide long-term observations of the beach-dune development between storm seasons. In addition, 3 Acoustic Doppler Velocimeters (ADVs) were deployed during storm Pia, in December 2023, to acquire flow velocities.
Results
Storm activity varied from none to multiple intermediate storms during a single storm season. The bed level measurements showed a distinct alongshore variability in morphological response to storms across the entire bar-beach dune system. Dune erosion volumes and modes of foredune failure also varied alongshore, exhibiting correlations with pre-storm morphological properties, such as beach width, sandbar depths, and foredune slopes. During storm Pia (on 22 December 2023), water levels reached up to 3 m above mean sea level (NAP), corresponding to the approximate elevation of the dune toe, and offshore wave heights of 5-6 m. As a result, dune erosion varied from 1-2 m scarps at the top of the beach to rotational failures and translational slides of the entire foredune. Storm Pia was preceded by a storm with less elevated water levels 3 weeks earlier, which eroded the beach. At the meeting we will present the data collected during this set of storms, which provides valuable insight into the effect of storm sequences. Furthermore, we aim to discuss the preliminary findings, measurement strategy and future plans for our QRF activities.
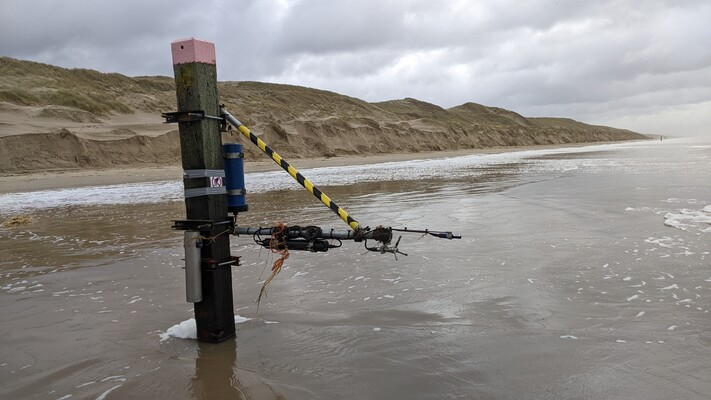
An Acoustic Doppler Velocimeter (ADV) mounted to a beach pole, with dune erosion in the background resulting from storm Pia in December 2023.
References
Ruessink, B.G.., Schwarz, C.S., Price, T.D., Donker, J.J.A., (2019), A Multi-Year Data Set of Beach-Foredune Topography and Environmental Forcing Conditions at Egmond aan Zee, The Netherlands. Data, 4, 73.
Investigating Biogeomorphological Processes through Numerical Modelling across Different Time Scales in Salt Marshes
S. Dzimballa1*, P.W.J.M. Willemsen1,2, V. Kitsikoudis1, B.W. Borsje1, D.C.M. Augustijn1
1 University of Twente, Netherlands; 2 Deltares, Netherlands
* Corresponding author: s.dzimballa@utwente.nl
Introduction
Salt marshes are important ecosystems in a world affected by climate change, as they provide numerous ecosystem services such as carbon sequestration (Barbier et al., 2011). They can also contribute to flood protection (Vuik et al., 2016). However, the complex spatiotemporal dynamics of salt marshes need to be understood to take their wave attenuation function into account when designing flood defences. Previous studies have shown that salt marshes' lateral extent is directly related to their wave attenuation potential, which varies spatiotemporally due to lateral retreat and expansion (Willemsen et al., 2020). Numerical models have been used to predict salt marsh evolution. These models are often limited in the processes considered depending on the aim of the study (Brückner et al., 2019; Mariotti, 2020). However, to capture and disentangle the complex biogeomorphological interactions, it is important to consider further processes within salt marsh evolution occurring at different temporal and spatial scales, such as seasonal vegetation dynamics, the effect of the root system on soil erodibility, multiple vegetation species and interspecies interactions. Thus, incorporating these processes in salt marsh models and accessing their individual effects on marsh development can provide important insights for predicting salt marsh development and lateral extent using numerical modelling.
Objective and Methods
This study aims to identify the importance of including shorter-term dynamics in numerical models to simulate long-term salt marsh development. By studying the biogeomorphological evolution of salt marshes over 50 years, we investigate the interplay of processes operating on different time scales. Marsh development is simulated using a coupled numerical model that integrates Delft3D Flexible Mesh for flow, morphology, and wave simulation with a dynamic vegetation module for an idealised domain. The established vegetation model simulates vegetation establishment, growth, and decay (Willemsen et al., 2022). The vegetation model is extended with seasonal vegetation dynamics, the presence of multiple species and inter-species interactions, and the effect of the root system on erosion by a spatiotemporally variable critical bed shear stress. External forcing from tides and constant and time-varying waves are considered. Furthermore, marsh-related modelling parameters (e.g. drag coefficient of vegetation) are varied to assess that influence compared to including more detailed salt marsh mechanisms.
Results
The study highlights the influence of different processes on lateral marsh extent. Seasonal variations influence longer-term marsh development, with seasonally lower wave forcing during the summer months leading to increased seaward establishment of vegetation. In addition, including non-uniform critical bed shear stress for erosion stabilises the seaward marsh extent and increases the overall mean vegetation density. were site-specific, depending on factors such as elevation and tidal range. It is, therefore, crucial to identify relevant site-specific processes to determine data requirements for predicting salt marsh development. These findings contribute to establishing confidence in numerical model predictions of salt marsh evolution, providing the basis for assessing marsh resilience and informing flood protection strategies.
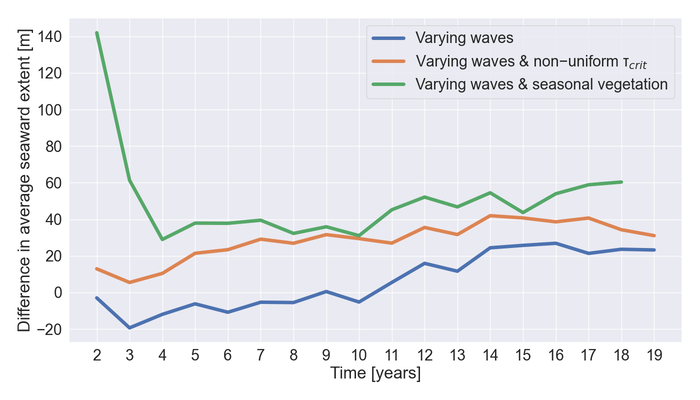
Figure 1: Differences in average seaward salt marsh extent for different scenarios compared to the 'Constant waves' scenario over the simulation time.
References
Barbier, E. B., Hacker, S. D., Kennedy, C., Koch, E. W., Stier, A. C., & Silliman, B. R. (2011). The value of estuarine and coastal ecosystem services. In Ecological Monographs, 81(2), 169–193. https://doi.org/10.1890/10-1510.1
Brückner, M. Z. M., Schwarz, C., van Dijk, W. M., van Oorschot, M., Douma, H., & Kleinhans, M. G. (2019). Salt Marsh Establishment and Eco-Engineering Effects in Dynamic Estuaries Determined by Species Growth and Mortality. Journal of Geophysical Research: Earth Surface, 124(12), 2962–2986. https://doi.org/10.1029/2019JF005092
Mariotti, G. (2020). Beyond marsh drowning: The many faces of marsh loss (and gain). Advances in Water Resources, 144. https://doi.org/10.1016/j.advwatres.2020.103710
Vuik, V., Jonkman, S. N., Borsje, B. W., & Suzuki, T. (2016). Nature-based flood protection: The efficiency of vegetated foreshores for reducing wave loads on coastal dikes. Coastal Engineering, 116, 42–56. https://doi.org/10.1016/j.coastaleng.2016.06.001
Willemsen, P. W. J. M., Borsje, B. W., Vuik, V., Bouma, T. J., & Hulscher, S. J. M. H. (2020). Field-based decadal wave attenuating capacity of combined tidal flats and salt marshes. Coastal Engineering, 156(January), 103628. https://doi.org/10.1016/j.coastaleng.2019.103628
Willemsen, P. W. J. M., Smits, B. P., Borsje, B. W., Herman, P. M. J., Dijkstra, J. T., Bouma, T. J., & Hulscher, S. J. M. H. (2022). Modeling Decadal Salt Marsh Development: Variability of the Salt Marsh Edge Under Influence of Waves and Sediment Availability. Water Resources Research, 58(1), 1–23. https://doi.org/10.1029/2020WR028962
Reducing the impact of recreation: Are pathways the solution to vegetated beaches?
S.J. van Rosmalen1*, J-M. Homberger1, M.J.P.M. Riksen1, J. Limpens1
1Wageningen University and Research, the Netherlands
*sasja.vanrosmalen@wur.nl
Introduction
Sandy shores provide multiple services: they protect the inland from flooding, support a high biodiversity, and are recreation hotspots (Everard, Jones, and Watts 2010). Not all services can co-exist, however. For example, recreation reduces species abundance and diversity by adding an additional stressor to the system (van Rosmalen, et al. in prep). Research found that directing visitor movements via boardwalks enables better co-existence of dune vegetation and recreation (Prisco et al. 2021). We investigated the effect of recreational pressure on the establishment of two common dune-building species Marram grass (Ammophila arenaria) and Sand-couch grass (Elytrigia juncea) in an area with existing pathways.
Objective and Methods
We conducted a field experiment at the mega nourishment the “Zandmotor” near The Hague, The Netherlands. We introduced both dune-building species by means of seeds and rhizomes at different distances to existing pathways. We used a randomised block design with 4 factorial treatments (species * diaspore type) and 30 replicates. Local genetic plant material was collected and introduced into plots of 50x50cm. The plant seeds were left in their husk to mimic natural dispersal. The position of each plot was recorded by means of Real-Time Kinematic positioning after which the plots were left unmarked to avoid influencing people's behaviour. Recreation pressure was assessed by counting visitors 5 times for 15 min at different sections of the research area across two days in July 2022. Establishment success was monitored by counting the number of emerged shoots from seeds and rhizomes per plot across the growing season of 2022. To control for other drivers, we also monitored environmental variables, such as the change in surface level.
Results
Our observations show that most visitors use the stable main pathways to move through the area. Preliminary results on the establishment success revealed that the negative effect of recreation is more localised compared to beaches without pathways. This suggest that creating landscape designs with clear path structures can promote the co-existence of plant biodiversity and recreation in embryo dune fields.
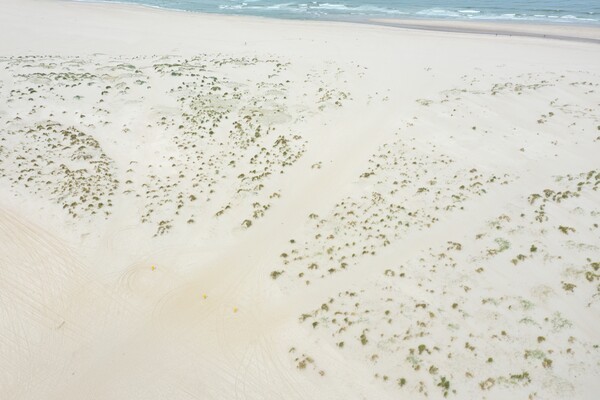
Figure 1: Research area on the Zandmotor with visible main pathways.
References
Everard, M., Jones, L., & Watts, B. 2010. “Have We Neglected the Societal Importance of Sand Dunes? An Ecosystem Services Perspective.” Aquatic Conservation: Marine and Freshwater Ecosystems 20 (4): 476–87. https://doi.org/10.1002/aqc.1114.
van Rosmalen, S. J., Homberger, J., Riksen, M.J.P.M., & Limpens, J. 2024. “Recreation impact on the early establishment of dune building grasses Elytrigia juncea and Ammophila arenaria on the beach.” [Manuscript in preparation].
Prisco, I., Acosta, A.T.R., Stanisci, A. 2021. “A bridge between tourism and nature conservation: boardwalks effects on coastal dune vegetation.” Journal of Coastal Conservation 25 (14). https://doi.org/10.1007/s11852-021-00809-4
Restoration of the bio-engineer Sabellaria in the Wadden Sea
M.J. Baptist1*, J.W.P. Coolen1, O.G. Bos1, J.P. Verdaat1, A. Meijboom1, O. Bittner1, N. Peck1, B.E. van der Weide1
1 Wageningen Marine Research, Den Helder, the Netherlands
* Corresponding author: martin.baptist@wur.nl
Introduction
Sabellaria worms are tube-dwelling polychaetes; they construct their own 'homes' using sand. Unlike solitary tube worms, they form interconnected reefs composed of sandstone-like material. These reefs are therefore commonly referred to as ‘Sandkoralle’ in German. Two species of Sabellaria worms are found in the Northeast Atlantic region: the Ross worm Sabellaria spinulosa and the honeycomb worm Sabellaria alveolata. Reefs of Sabellaria were a prevalent sublittoral structure in the 20th century in the German Wadden Sea. Intertidal reefs were also documented. Until the 1950s, reefs were found in many locations, but their occurrence has since declined and reefs do no longer exist in the Wadden Sea.
Objective and Methods
The 3D structure of the reefs attracts high species richness and in addition the reefs also provide ecosystem services such as wave attenuation and sediment stabilization. Restoration of these reefs will therefore restore important structures and functions of the Wadden Sea. This study mapped the habitat preferences for Sabellaria based on depth, flow velocity, sediment grain size, salinity and gully slope. A potential hotspot was identified and was surveyed using side-scan sonar, an underwater drone and with divers.
Results
We found a rich fauna of sponges, anemones and sea squirts on a 40 ha large stone revetment near Texel. And, we found an individual of Sabellaria spinulosa. Follow-up steps to restore these reefs in the Wadden Sea will be discussed.
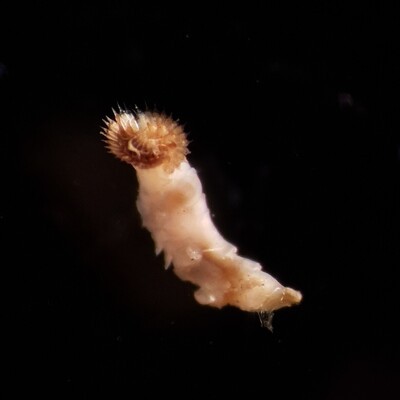
Sabellaria spinulosa tubeworm found near Texel.
Intertidal vegetation altering currents in the Scheldt estuary
J. Bootsma1*, B.W. Borsje1 , D. van der Wal1,2, S.J.M.H. Hulscher1
1 University of Twente, the Netherlands; 2 Royal Netherlands Institute for Sea Research (NIOZ), the Netherlands
* Corresponding author: jesse.bootsma@utwente.nl
Introduction
Vegetation on intertidal areas acts as ecosystem engineers by affecting both habitats for species and currents. These vegetated areas are dynamic over space and time, including a changing vegetation extent, shifts in species distribution and changes in vegetation traits such as height and flexibility. All of these affect the ecosystem engineering capacity of vegetated intertidal areas. In this paper, we focus on the impact of intertidal vegetation on currents in an estuary. Central to this study are the spatiotemporal dynamics of vegetation on fringing and mid-channel flats and the effect on currents. Therefore, this paper aims to assess the impact of intertidal vegetation on currents for the Scheldt estuary.
Objective and Methods
A combination of available vegetation maps and remote sensing techniques, together with a hydrodynamic model (Delft3D-FM), is adopted to study this impact. The vegetation maps are derived from Rijkswaterstaat for the Western Scheldt, spanning the period 1993 to 2016 with a frequency of 6 years. These maps provide insights into the total marsh extent and the distribution of species communities. Next to that, Landsat satellite imagery is processed in Google Earth Engine (GEE) to distinguish between marsh, mudflat and open water, based on pixel scale NDVI (vegetation index) and NDWI (water index). Furthermore, the NDVI values are used as a proxy for vegetation density, which, combined with literature-based vegetation characteristics, results in a number of stems per square meter. The vegetation data is then used as input for a hydrodynamic model of the Scheldt estuary, which was previously calibrated and validated by Deltares using a 2013 hindcast (Tiessen et al., 2016). In this study, the impact of vegetated intertidal areas is investigated for a period of calm weather conditions in May 2013 and a period of storm conditions in December 2013 (known as the Sinterklaasstorm).
Results
The vegetation maps show an increase in total marsh extent in the Western Scheldt, from 2483 ha in 1993 to 3350 ha in 2016. This increase is seen for common reed (Phragmites australis) communities, whereas no clear trend is observed for other dominant species communities. Vegetation establishment is especially present at the mid-channel flats Hooge Platen and Plaat van Walsoorden, shifting from a bare to a vegetated flat. When modelling a scenario with spatially uniform vegetation (hv =25 cm, bv = 5 mm, N = 1000 stems/m2, Cd = 1) and comparing this with a bare flat scenario, flow reduction within the vegetated marshes and flow enhancement around the marshes becomes apparent. During storm conditions, the impact of vegetation on flow velocity magnitude is present for the entire estuary just after high tide, while the impact on water levels is only locally (Figure 1). Furthermore, the impact of spatially varying vegetation (multiple species) vs spatially uniform vegetation (single species) is studied as well as a comparison between 1993 and 2016. Between these years, the largest change in vegetation cover is observed, thus the largest difference in the impact on currents is expected. Quantifying the magnitude and extent of intertidal vegetation's impact on currents is useful for our understanding of estuarine hydrodynamics.
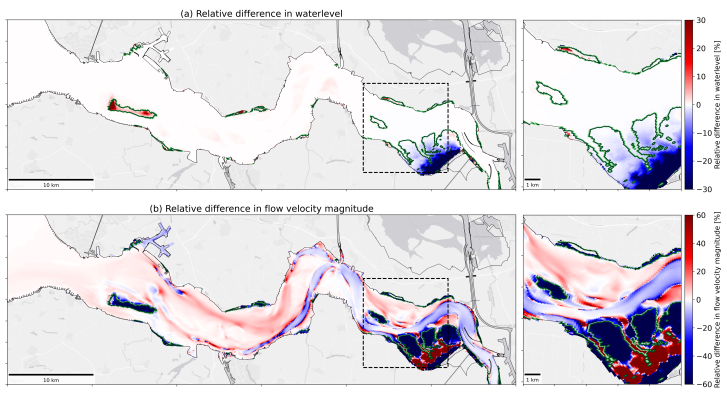
Figure 1: Relative difference ((vegetated – unvegetated)/unvegetated *100) in (a) water levels and (b) flow velocity magnitude during high tide at storm conditions (Sinterklaasstorm 2013), Western Scheldt, the Netherlands. Extent of vegetation is indicated with the green contour lines.
References
Tiessen, M.C.H., Vroom, J. & van der Werf, J.J., (2016), Ontwikkeling van het Delft3D FM NeVla model voor het Schelde estuarium, Deltares
Fish migration river (VMR), Afsluitdijk. Part I: expected morphological effects Lake IJssel
M. Traas1*, N. Geleynse1, K. van der Laan1, K. Röell1, L. Perk1
1 WaterProof Marine Consultancy and Services
* meike.traas@waterproofbv.nl
Introduction
Near the discharge locks at Kornwerderzand, a cut in the Afsluitdijk is realized for fish migration. At the Lake IJssel side, a meandering stream is planned: the fish migration river (VMR). Here, fish can adapt to the saline-fresh water transition. Our study focuses on two aspects: (1) expected changes in the morphology of the lake bed eastward of the VMR and adjacent to the existing scour holes at the discharge locks and (2) expected changes in the salinity distribution. This work focuses on the first aspect.
Objective and Methods
To determine the expected future morphological changes, first the existing lake bed is characterized. To this end, we took bed samples at various locations in the study area for grain size analysis, to determine the sand-mud composition and to perform erosion tests in the flume. The data acquired from the laboratory tests served as input for the construction of a Delft3D morphodynamic model of the study area. Discharge data were used as hydrodynamic forcing. Measured changes based on recent multibeam surveys by Rijkswaterstaat were analysed and used to calibrate the model for the existing bathymetric configuration.
Results
The calibrated model provides a useful tool to assess the morphological response of the lake bed to specific interventions entailing bathymetric changes as well as to future changes in the lock discharge regime.
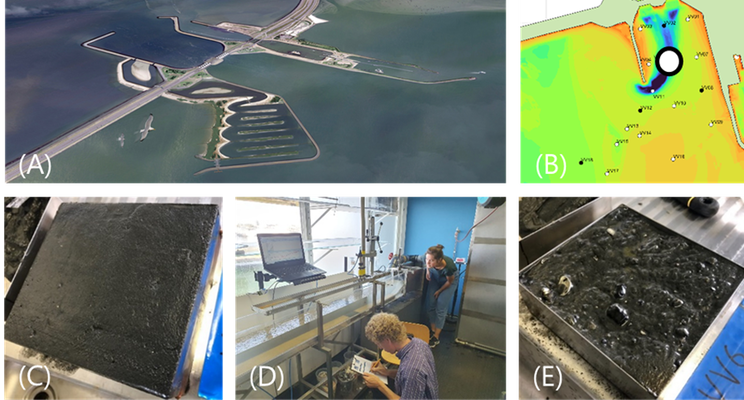
Figure 1: (A) Artist impression VMR, (B) Location bed samples, (C) Sample prior to erosion experiment (D) Set-up of flume in lab WaterProof, (E) Bed sample after execution of erosion experiment.
Coastal Vision – more than coastal protection. About the tools we needed to define this strategic policy plan.
A. Bolle1, B. Verheyen1, T. Vanagt2, H. Castro1, A. Breugem1, and A. Dastgheib1,3
1 IMDC, 2 ORG, 3 IHE Delft
* Corresponding author: annelies.bolle@imdc.be
Introduction
With Coastal Vision, the Flemish government has defined a strategy to keep protecting the coast on the long run, even up to 3 meter sea level rise. Starting point for this is the 2011 Master Plan for Coastal Safety which consists of a series of measures to protect Flanders’ coast against a 1000-year storm event until 2050, including 30 cm sea level rise. But in the future we need to do more, to make sure also the children of our grandchildren can keep enjoying our coast. Several alternatives have been studied, evaluated and compared, in order to select the most promising alternative.
At this moment the public consultations of the draft strategic policy plan are ongoing (see also www.kustvisie.be), allowing everyone to get insight in the plan, and how we got to the proposed alternative ‘Seaward’ for future coastal protection. The coastline will move on average about 100 m seaward, and dunes and dikes will be raised and widened to keep the hinterland dry when sea level rises. By keeping our beaches at least as wide as today, ‘Seaward’ offers space and opportunities for, among other things, experiencing nature, sports, recreation and the economy.
Objective and Methods
In order to define the preferred alternative, numerous tools have been applied in the studies during the past years, each with their own purpose and strengths. The tools are diverse and range from hydrodynamic, wave and flood models to calculate the future flood risk and possible victims during extreme storm events combined with increased sea level rise; over 1D and 2D hydromorphological models to design the future coastal protection, to aeolian models, groundwater and salinity calculations to estimate to effect of future coastal protection measures on the environment, as well as economical models to assess costs and benefits, amongst others.
All these models had to provide suitable input to evaluate and compare the proposed reasonable alternatives. For this an extensive evaluation framework has been developed, reflecting the framework of ambitions that has been defined at the start of the process, together with all stakeholders involved. This integrated evaluation goes well beyond the traditional environmental impacts and economical costs and benefits, although these are included as well.
Results
Defining and selecting the right models and the appropriate level of detail was a continuous process. Whereas some criteria where clearly defined from the beginning, some others popped up or became more important after interactions and discussions with the stakeholders. Some subjects became crucial in distinguishing between different alternatives or were questioned time after time: such as the maintenance volumes for sandy coastal protection measures, the effect of new dunes on future salt intrusion, etc.
Keeping the balance between a thorough answer and too much detail, given the strategic nature of this phase of Kustvisie, was a challenge. Therefore a common understanding needed to be found between the models applied, the level of detail included, and the meaning of the results for the comparisons of the alternatives. Also lacks in the current knowledge, available data or the capabilities of the models where identified, so future improvements can be initiated. These further investigations are also included in the first action plan, after discussion with the administrations and stakeholders involved.
This papers shares some best practices and points of attention for the modelling at strategic level, and what was, from our experience the most crucial tool applied.
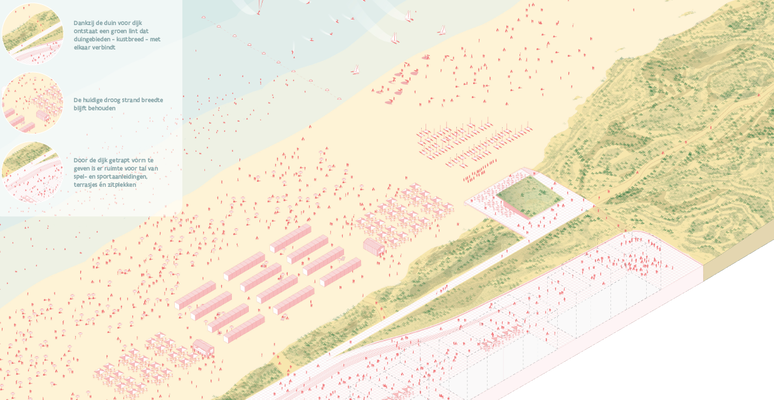
Figure 1: Example of a possible extended dune landscape as one of the possible coastal protection measures in the preferred alternative ‘Seaward’ for the beach zones. Image ©Hoogtij(d)
The effect of a compound drought and heatwave event on the coastal dune building grass Elytrigia juncea
Paul M.J. Berghuis 1,2, Carlijn Lammers1,3, Max Rietkerk2, Johan van de Koppel3,4, Tjisse van der Heide1,3,Valérie C. Reijers5, Angeles G. Mayor6
1Department of Coastal Systems, Royal Netherlands Institute for Sea Research, the Netherlands;
2 Copernicus Institute of Sustainable Development, Utrecht University, The Netherlands;
3 Groningen Institute for Evolutionary Life Sciences, University of Groningen, The Netherlands
4 Department of Estuarine and Delta Systems, NIOZ Royal Netherlands Institute for Sea Research, The Netherlands
5 Department of Physical Geography, Utrecht University, The Netherlands
6 Department of Biodiversity, Ecology and Evolution, Universidad Complutense de Madrid, Spain
* Corresponding author: paul.berghuis@nioz.nl
Introduction
Coastal dunes systems are worldwide threatened by enforced erosion, due to climate change induced sea level rise and increased storm frequency. For these systems to persist, timely recovery from disturbance is essential. These ecosystems occur in harsh environments with limited fresh water, and physical stress of waves and wind. Dune grasses escape these conditions by trapping sediment, forming dunes as their density and patch size increases. This bio-geomorphic feedback enables vegetation to rapidly build dunes, but the self-facilitating component makes dune grasses vulnerable at an early stage.
Objective and Methods
How new established patches, crucial in recovery, will perform under the varying effects of climate change remains underexplored. In this study we investigate the effect of a experimental compound drought and heatwave (CDHW) event on the growth of a pioneer dune grass. We conducted a 4-week manipulative field experiment on the Dutch barrier island of Schiermonnikoog. In this full-factorial experiment we crossed small establishing patches of Elytrigia juncea with larger established patches growing in ambient conditions or under a greenhouse structure simulating a CDHW event.
Results
Both patch sizes of E. juncea did not show any plant decline in response to the CDHW treatment. On the contrary an increased growth was observed, most evident in the form of elongated shoots. Soil moisture content was found independent of patch size, but abundant underneath all patches. This availability of freshwater mitigated the drought effects of the CDHW treatment. Moreover, instead of amplifying drought effects, the increased temperatures could now promote plant growth. The occurrence of soil moisture to buffer drought effects on establishing dune grass patches and the role herein of bio-geomorphic feedbacks is something to be further explored.
Guano-mediated island genesis in the Dutch Waddensea
F.F. van Rees1,2,3, L.L. Govers2,4 , P. Guseva1, M. Zwarts1,2, C. Tuijnman1, T. Rudde2, B.G. Ruessink1, K.C.J. Camphuysen2, V.C. Reijers1
1Utrecht University, The Netherlands; 2Royal Netherlands Institute for Sea Research, The Netherlands; 3Deltares, The Netherlands; 4University of Groningen, The Netherlands
* Corresponding author: floris.van.rees@nioz.nl
Introduction
Guano, or bird excrement, plays a crucial role in enhancing ecosystem productivity by boosting soil nutrients and promoting vegetation growth, a phenomenon well-documented on islands with hard substrates. However, the impact of guano on sandy islands remains underexplored, even though biogeomorphological processes are crucial for the development of these landscapes. In this study, we investigate the influence of shorebird guano on changes in plant community composition and plant traits occurring on sandy islands in the Dutch Wadden Sea. Our research objectives are multifaceted: firstly, to estimate theoretical guano deposition rates (TGDR) based on the spatial properties of bird colonies on these islands; secondly, to identify a reliable indicator for the transfer of nutrients from TGDR to vegetation; and thirdly, to determine if the nutrient flow from bird colonies alters the composition and traits of plant communities. This exploration sheds light on the significant ways avian colonies contribute to shaping sandy island ecosystems through bio-physical interactions.
Objective and Methods
To address our research objectives, our methodology unfolds in three key stages. Initially, we crafted a numerical model to calculate TGDR, transforming data on breeding bird colony characteristics—such as bird biomass, residence duration, and nest density—gathered by local nature reserve managers from five uninhabited sandy islands: Richel, Griend, Rottumeroog, Rottumerplaat, and Zuiderduin. Subsequently, we monitored the nitrogen transfer from bird guano to plants, determined through δ15N isotope analyses of plant samples collected from these islands. Finally, we evaluated the plant species composition and key vegetation traits (biomass, rooting depth, and height) at these locations. The assessment of plant species diversity was conducted using non-parametric multi-dimensional scaling, emphasizing the two primary axes. To unravel and quantify the complex interactions between TGDR, δ15N isotope levels, plant species composition, and vegetation traits, we employed a piece-wise structural equation model (PSEM) which included lagged spatial autoregressive models.
Results
Our analysis revealed that TGDR varied between different colonies. Larus ssp. had relatively low TGDR values, while Chroicocephalus ridibundus and Thalasseus sandvicensis had relatively high TGDR values, explained by low and high nest densities respectively. The TGDR was used as input for the PSEM. The PSEM global goodness-of-fit tests yielded significant results (Chi-Squared = 4.0, p = 0.6), indicating that the overall model fit was statistically significant, see Figure 1 for standardized coefficient estimates. Crucially, the model demonstrated a significant association between TGDR and δ15N levels (β = 0.22, p = 0.0239), highlighting effective nutrient transfer from guano to vegetation. This nutrient enrichment notably shifted plant community compositions towards species like Leymus arenarius and Elytrigia juncea, contrasting with areas less affected by guano, which favored Festuca spp. Additionally, the analysis showed that guano deposition positively influences vegetation height (β = 0.24, p < 0.05), suggesting an indirect role of birds in habitat formation through enhanced plant growth. These insights underscore the complex interactions between bird colonies and sandy island ecosystems, highlighting how guano deposition contributes to bio-physical interactions and landscape modification.
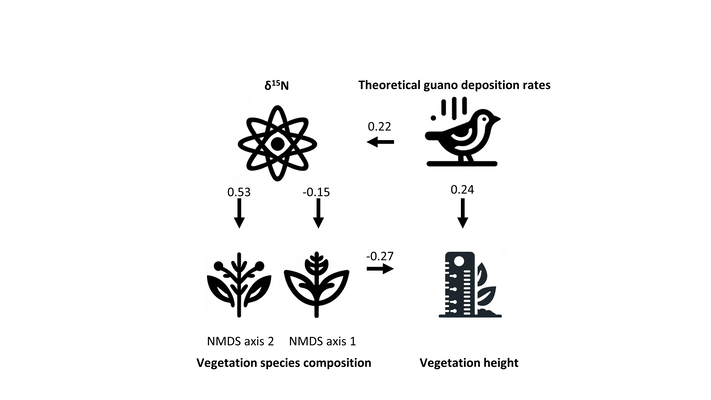
Outcome of the piece-wise structural equation model. The numbers represents the standardized coefficient estimate. It's the coefficient estimate scaled by the standard deviation of both the predictor and the response variables.
Closure history of the former Bergen Inlet during the transition from mid to late Holocene
S. van Heteren1*, R. Kooij2,3, R.G. Nieboer3, K.M. Cohen2, A.J.F. van der Spek2,4
1 TNO - Geological Survey of the Netherlands, * sytze.vanheteren@tno.nl
2Faculty of Geosciences, Utrecht University
3Deltares, Applied Geology and Geophysics Department
4Deltares, Applied Morphology Department
Introduction
Some 5000 years ago, Bergen Inlet formed one of the largest gaps in the barrier coast of the western Netherlands. It connected an enormous tidal basin to the North Sea, and dominated coastal development in a wide adjacent area for thousands of years. At its peak, the prism of this tidal inlet was similar to that of Texel Inlet before closure of the Zuiderzee. The demise of the inlet has been reconstructed using a wealth of morphological and subsurface data on land. After a little more than 4000 years of activity, the inlet closed around 3500 cal BP, leaving stacked tidal-channel and channel-fill facies of different age.
Objective and Methods
A large part of the deposits left by Bergen Inlet is located offshore, where their lateral extent and variability are not yet understood. A survey just offshore the province of Noord-Holland yielded a set of seismic lines (850 km covering 500 km2) and vibrocores (23). Supplemented by 19 recently obtained radiocarbon dates, this dataset sheds light on how the seaward half of the inlet developed. Despite some blanking of the signal caused by shallow gas formed in organic-bearing deposits, the seismic profiles provide valuable, laterally continuous images that are missing on land.
Results
Two key elements of a fragmentary Holocene sequence are large-scale tidal-channel deposits associated with the active inlet, and a clayey fill representing inlet demise. The base of sandy inlet-related units reaches its deepest point about 8 km seaward of the modern shoreline, where it is more than 10 m deeper than below the land. The base of the younger inlet fill is at least 5 m shallower than onshore. Assuming that this deepest point denotes the inlet throat, this implies about 10 km of landward coastline migration while the inlet reduced in size. The new radiocarbon dates put some initial constraints on offshore-onshore facies connections but more time control is needed to fully understand the rise and fall of Bergen Inlet.
Pan-European coastal vulnerability: developing a new EMODnet Geology data product for coastal behaviour
C. Moses1, S. van Heteren2*, C. Butterill1, T. Chopra1, S. Follows1, A. Humphries1, L. Jones1, M. Weil1
1 Edge Hill University, Department of Geography and Geology, Ormskirk, United Kingdom
2 TNO - Geological Survey of the Netherlands, * sytze.vanheteren@tno.nl
* Corresponding author: sytze.vanheteren@tno.nl
Introduction
The identification and communication of potential risks faced by coastal-zone populations is becoming increasingly important. It strengthens society’s resilience and enables communities to better handle coastal hazards. This so-called coastal vulnerability has been assessed, quantified and mapped using a wide variety of approaches, focussing on hazard, risk and resilience. Many studies place emphasis on physical parameters such as geology and topography, and on marine factors such as wave energy and storm frequency. Others also incorporate socio-economic factors such as population, cultural heritage, presence of crucial infrastructure, land use and conservation status.
Objective and Methods
Our pan-European assessment of coastal vulnerability adds a new layer of information to the existing EMODnet Geology product suite on shoreline change. Using the most complete inventory to date of case studies on coastal vulnerability in scientific journals, books and governmental reports, we have developed a database capturing various vulnerability aspects across Europe and in other countries around the world. By geo-locating the maps from these studies and developing a common legend, we were able to create a harmonised map indicating lower, intermediate and higher levels of vulnerability at a pan-European scale. Our research indicates good yet incomplete coverage by existing studies. It highlights the need to use data from existing EMODnet products such as shoreline migration, geology and bathymetry in developing a basic coastal vulnerability index that can be validated against existing studies and used to fill the gaps.
Results
The resulting applied data product will help raise awareness in the general public and facilitate the work of coastal policy makers, planners and practitioners.
Knowledge and Innovation at the Marker Wadden
A.M. Ton1*, T. Van Kessel1 , J. Kollen2, R. Noordhuis1, J. de Leeuw3, M.S. van den Berg4,5, Q. Smeele6, K. Kaffener7
1 Deltares, The Netherlands; 2 Sweco, The Netherlands, 3 Wageningen Marine Research, 4 Rijkswaterstaat, The Netherlands, 5 Aeres Hogeschool, The Netherlands, 6 Natuurmonumenten, The Netherlands, 7 Ministry of Infrastructure and Water Management, The Netherlands
* Corresponding author: Anne.Ton@Deltares.nl
Introduction
Well-functioning, natural, lowland freshwater lakes commonly possess elements such as gradual land-water transitions, heterogeneity in water depths or water-level fluctuations (Schindler et al., 2002). The traditional engineering structures and artificial water level control present in lake Markermeer oppose these elements. To enhance the ecological integrity of lake Markermeer, an archipelago of shallow marsh islands, called Marker Wadden, was constructed between 2016 and 2018 to add the structure and dynamics that are more typical for a natural freshwater lake, while maintaining the lake’s current ecosystem services (Van Leeuwen et al., 2021).
Research results from KIMA 1.0 (Knowledge and Innovation program Marker Wadden, 2017-2022*) show that the new ecosystem is still developing and that the islands are being shaped by waves, currents and consolidation. It is yet to be confirmed that the Marker Wadden contribute or moreover lead to a robust and climate adaptive lake Markermeer.
The use of mud is an important building block for maintenance of the islands and the long term stability of the reed marsh. When the fines are harvested in the right places this contributes to the water quality around the islands and collecting and relocating them can be part of maintenance of consolidating islands.
Objective and Methods
The objective of KIMA 2.0 (2023-2026) is to research what is needed for futureproof islands that have a positive impact on water quality and productivity in lake Markermeer. We focus on mud and food flows between and around the Marker Wadden and the interaction between ecological processes.
The project leads to an action perspective for acceleration of natural mud accretion in the compartments and lee areas. Moreover, a feasibility study on slow dredging and deposition to further accelerate mud accretion will show the potential for sustainable maintenance of the islands. We will quantify the supply and sedimentation of the mud as a function of flow and wave conditions and the extent of the local reed marsh.
To gain insight into the mud flows, field monitoring is needed. This is a combination of bathymetric surveys, sediment sampling and measurements of currents and waves, which is planned for 2024 and 2025. With the field data, a numerical model is validated and the impact of the design of the islands on capturing mud is analyzed. Parallel, a feasibility study on small-scale, sustainable, “slow” dredging is executed.
Results
The islands or compartments consist of sandy ring dikes, filled with mud. After several rounds of addition of a muddy layer, consolidation and ripening the islands submerged. Most islands are now in open connection to lake Markermeer. Earlier research shows that the sand mining pits around the islands and the lee areas near the islands capture mud, positively affecting the local mud balance and turbidity. We expect to quantify this effect further, with a focus on the flows between and around the islands. Ideally, we will be able to predict whether an equilibrium between consolidation and inflow of sediment is possible in the future and advise on maintenance or even design of new islands to ensure this equilibrium.
Results already show that the concept of “slow dredging” to increase mud flows towards the islands is technically feasible. This zero-emission and vegetation friendly technique is promising, and inquiry into a possible pilot study is ongoing.
The results on mud flows will be combined with research on food and nutrient flows, to result in guidance towards a robust and climate adaptive reed marsh with a variation in biotopes facilitating birds and fish.
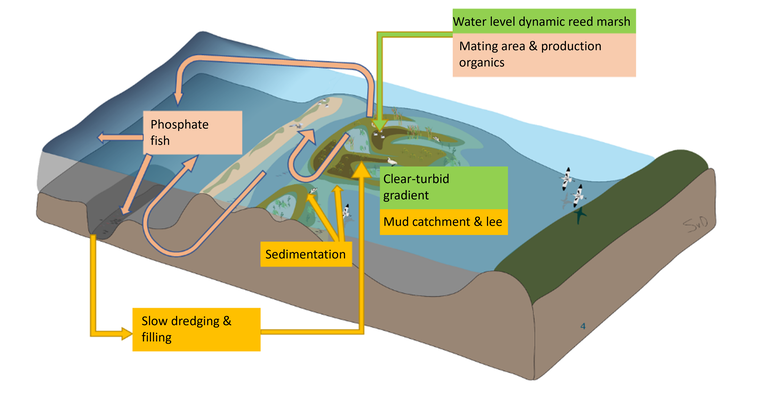
Transport of nutrients and fish (pink), mud management and maintenance islands (orange) and water level dynamics and formation reed marsh (green). (Illustration by Suzanne van Donk)
References
*https://waterinfo-extra.rws.nl/projecten/lijst-projecten/kennis-marker-wadden/kennis-innovatieprogramma-marker-wadden/final-results/
Schindler, D. E., & Scheuerell, M. D. (2002). Habitat coupling in lake ecosystems. Oikos, 98(2), 177–189.
Van Leeuwen, C. H., Temmink, R. J., Jin, H., Kahlert, Y., Robroek, B. J., Berg, M. P.,Lamers, L. P., Van den Akker, M., Posthoorn, R., Boosten, A., Olff, H.,
& Bakker, E. S. (2021). Enhancing ecological integrity while preserving ecosystem services: Constructing soft-sediment islands in a shallow lake.
Ecological Solutions and Evidence, 2(3), 1–10.
Learning from the past: hindcasting abiotic conditions before the closure of the Zuiderzee to better understand the recovery potential of subtidal Eelgrass (Zostera marina) in the western Dutch Wadden Sea
L. Jaksic1*, B. Smits1 , J. Dijkstra1, J. Vroom1, O. Franken2,3, K. Rehlmeyer2, J. de Vries4, R. Cammenga5, E. Lofvers5
1 Deltares, The Netherlands; 2 Rijksuniversiteit Groningen, The Netherlands; 3 NIOZ Royal Netherlands Institute for Sea Research, The Netherlands; 4 Rijkswaterstaat WVL, The Netherlands; 5 Rijkswaterstaat NN, The Netherlands
* Corresponding author: Luka.Jaksic@deltares.nl
Introduction
Large portions of the North Atlantic seagrass populations disappeared in the 1930s due to the outbreak of the 'Wasting Disease’. The disappearance of Eelgrass (Zostera marina) in the Dutch Wadden Sea coincided with the construction of a mayor closure dam [Afsluitdijk] which largely affected the abiotic conditions in this basin. Today, the recovery of Eelgrass is a goal in the Water Framework Directive and Natura2000. While intertidal Eelgrass shows signs of recovery resulting from restoration experiments and improved water quality (Van Katwijk, 2002), efforts to reintroduce the subtidal variety remain unsuccessful. The Waddenmozaïek project investigates the recovery potential of subtidal Eelgrass by measuring abiotic conditions, combining these with habitat suitability relationships from literature, and testing bottlenecks of abiotic conditions (Rehlmeyer et al., submitted). In this study, we expand on the existing field measurements and literature-based tolerance limits by re-creating the historical, Wadden Sea-specific, abiotic conditions relevant for Eelgrass growth in a numerical model. The hypothesis investigated here is that the closure of the Zuiderzee in the 1930s created long-term unfavourable abiotic conditions for Eelgrass growth, impeding its recovery to date. This study was set up within the research program BenO Waddenzee, with funding of the Water Framework Directive.
Objective and Methods
Numerical model simulations were employed to study the effect of the Zuiderzee closure on the abiotic conditions that could affect Eelgrass growth, such as light availability and salinity. To study both the direct effects and long-term morphological effects of the Zuiderzee closure, the existing 3D Dutch Wadden Sea model (Vroom et al., 2020) was adjusted to reflect the situation before and directly after the closure of the Zuiderzee, specifically including the effects of the then present meadows on water motion. This modified model setup was validated using historical water level data (quantitatively); and using bed sediment composition, salinity, and flow pattern maps from literature (qualitatively). Finally, habitat suitability maps were made based on the model results to investigate what areas in the present-day Wadden Sea are most promising for Eelgrass recovery.
Results
Our findings suggest that in the years following the closure of the Zuiderzee, some of the sites where subtidal Eelgrass once grew had temporarily become intertidal – and thus unsuitable for the recovery of subtidal Eelgrass. Our model results indicate that the other abiotic conditions for Eelgrass growth have generally deteriorated in the western Wadden Sea, particularly on the flats that once hosted the meadows. Reduced light availability, largely attributed to increased turbidity, plays an important part in this. The model results indicate an increase in turbidity due to the closure of the Zuiderzee, resulting in less favourable conditions in the present-day Wadden Sea. Our preliminary habitat suitability results based on model data, can help researchers and nature managers to indicate potentially suitable locations for Eelgrass restoration.
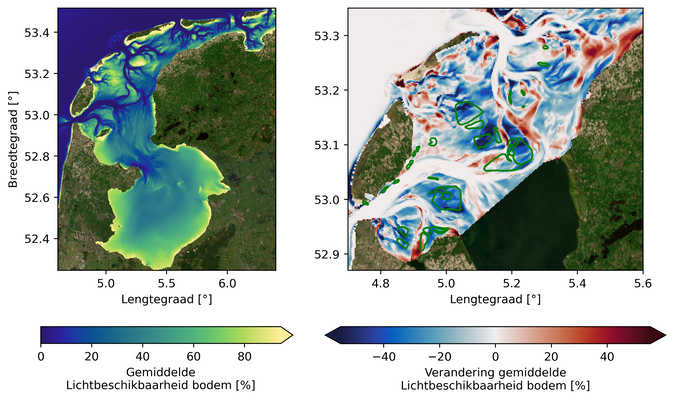
The near-bed light availability (% of the surface radiation) in 1927 (left) and the change between 1927 and 2017 (right). The light availability is based on spring-neap averaged model results during the growing season. Green contours indicate the locations of the former Eelgrass (Zostera marina) meadows.
References
Van Katwijk, M.M.; Van Pelt, S.; Dankers, N. (2002). Herintroductie van Groot zeegras in de westelijke Waddenzee (2002-2006). Inventarisatie van bestaande kennis, selectie van locaties en plan van aanpak. Katholieke Universiteit Nijmegen & Alterra. Rapport WeL0731.
Rehlmeyer, K.; Franken, O.; van der Heide, T.; Holthuijsen, S.J.; Meijer, K.J.; Olff, H.; Didderen, K.; Lengkeek, W.; Govers, L.L. (submitted). Reintroduction of self-facilitating feedbacks could advance subtidal eelgrass (Zostera marina) restoration in the Dutch Wadden Sea.
Vroom, J.; Van Weerdenburg, R.; Smits, B.; Herman, P. (2020). Modellering slibdynamiek voor de Waddenzee Kalibratie voor KRW slib. Deltares rapport 1205229-001-ZKS-0001.
Flume experiments of vegetation-induced sediment resuspension under combined wave-current flows
T.J. van Veelen1,2*, H.M. Nepf2, S.J.M.H. Hulscher1, B.W. Borsje1
1 University of Twente, The Netherlands; 2 Massachusetts Institute of Technology, United States
* Corresponding author: t.j.vanveelen@utwente.nl
Introduction
Salt marshes and other vegetated foreshores are valuable ecosystems for coastal protection, but they may grow and retreat over time. Salt marshes are intertidal wetlands, whose vegetation attenuates waves, currents and stabilizes foreshores, thereby reducing the load on dikes (Vuik et al., 2016). They also sequester carbon and are an important habitat for marine flora and fauna. Fine sediments are the core of a salt marsh. These are brought in by tides and waves and are deposited on and around the marsh. Understanding the sediment transport dynamics is essential in order to predict the morphological evolution of the marshes and the future protection that salt marshes will provide.
Vegetation modifies sediment transport dynamics compared to a bare bed. The vegetation modifies flow structure and produces turbulent eddies in its wake. It has been shown for pure currents (Liu et al., 2021; Tinoco & Coco, 2014) and pure waves (Tinoco & Coco, 2018) flows that these eddies reduce the velocity threshold for sediment resuspension, but it remains unclear how sediment resuspension responds to combined wave-current flows commonly found in estuaries. Our goal is to understand and quantify sediment resuspension under combined wave-current flows using flume experiments.
Objective and Methods
We conducted our experiments in the wave-current flume in the Nepf Environmental Fluid Mechanics Lab at the Massachusetts Institute for Technology, USA (Figure 1). The flume was 24m long, 0.38m wide and 1m high. We constructed a vegetation patch of 3m length from wooden dowels with diameter of 6.4 mm. The vegetation density was set at 0 (no vegetation), 250 (sparse), 500 (medium), or 1000 (dense) stems/m2. The middle board (length 1m) was constructed with a recess that was filled with a 10mm layer of artificial sediments made from non-cohesive glass spheres with a mean diameter of 35 (fine) or 70 (medium) microns. We installed an acoustic doppler velocimeter (ADV) to measure current, wave, and turbulent velocities, two optical backscatter sensors (OBS) to measure sediment concentration, and two cameras to capture videos. For each experiment run, we set the current velocity, and incrementally increased the wave height until a sediment concentration above the noise level was recorded by at least one of the OBSs. We defined this as the threshold for resuspension. We then let the experiment continue for 90 minutes for bedforms to develop and repeated the experiment to investigate the effect of bedforms on resuspension.
Results
Our experiments show that vegetation reduces the velocity threshold of resuspension in combined wave-current flows. The reduction is the strongest for flows with a dominant current component and weaker for conditions with a dominant wave component, although the threshold is still reduced under pure wave conditions. The effect of vegetation density seems insignificant. The resuspension occurs when the turbulent kinetic energy peaks in the wake of the stems (see enlargement in Figure 1). Additionally, we find that ripples or scour holes develop in the meadow. Ripples develop in pure wave flows and scour holes in pure current and combined wave-current flows. Ripples further reduced the velocity threshold of resuspension, whereas scour holes increased the threshold. The effect of bedforms remains small compared to the impact of vegetation. Our results enable the development of sediment transport formulations within vegetation meadows, which can be applied to simulate sediment transport patterns in and around salt marshes and other vegetated habitats.
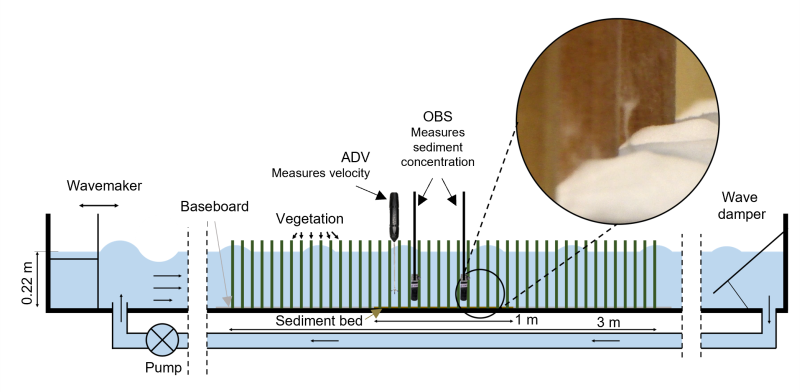
Figure 1: Sketch of the experiment setup. The enlargement shows sediment resuspension through a turbulent vortex in the wake of the vegetation. The white breaks in the figure denote stretches of empty flume. Figure not to scale.
References
Liu, C., Shan, Y., & Nepf, H., 2021. Impact of Stem Size on Turbulence and Sediment Resuspension Under Unidirectional Flow. Water Resources Research, 57(3), e2020WR028620. https://doi.org/10.1029/2020WR028620
Tinoco, R. O., & Coco, G., 2014. Observations of the effect of emergent vegetation on sediment resuspension under unidirectional currents and waves. Earth Surface Dynamics, 2(1), 83–96. https://doi.org/10.5194/esurf-2-83-2014
Tinoco, R. O., & Coco, G., 2018. Turbulence as the Main Driver of Resuspension in Oscillatory Flow Through Vegetation. Journal of Geophysical Research: Earth Surface, 123(5), 891–904. https://doi.org/10.1002/2017JF004504
Vuik, V., Jonkman, S.N., Borsje, B.W., & Suzuki T. (2016) Nature-based flood protection: The efficiency of vegetated foreshores for reducing wave loads on coastal dikes. Coastal Engineering, 116, 42-56. https://doi.org/10.1016/j.coastaleng.2016.06.001
Fish migration river (VMR), Afsluitdijk. Part II: expected salinity effects Lake IJssel
N. Geleynse1*, K. van der Laan1, M. Traas1, L. Perk1
1 WaterProof Marine Consultancy & Services
* Corresponding author: nathanael.geleynse@waterproofbv.nl
Introduction
Near the discharge locks at Kornwerderzand, a cut in the Afsluitdijk is realized for fish migration. At the Lake IJssel side, a meandering stream is planned: the fish migration river (VMR). Here, fish can adapt to the saline-fresh water transition. Our study focuses on two aspects: (1) expected changes in the morphology of the lake bed eastward of the VMR and adjacent to the existing scour holes at the discharge locks and (2) expected changes in the salinity distribution. This work focuses on the second aspect.
Objective and Methods
To determine the expected changes in salinity in Lake IJssel, the measured salinity response to various lock discharges was studied. Also, a 3-D Delft3D model was constructed to compute the salinity fields. Firstly, measured salinity levels were used to calibrate the model in terms of the influx of salt at the onset/stop of discharging and due to leakage through the lock complex. The calibrated model was then used to examine the changes in salinity levels due to various effects, including changes in layout, lock discharges and wind effects.
Results
The 3-D Delft3D model provides a useful tool to assess the salinity response to changes in the layout related to the construction of the VMR. The effects of future changes in the lock discharge regime or wind on the salinity distributionin Lake IJssel can also be assessed.
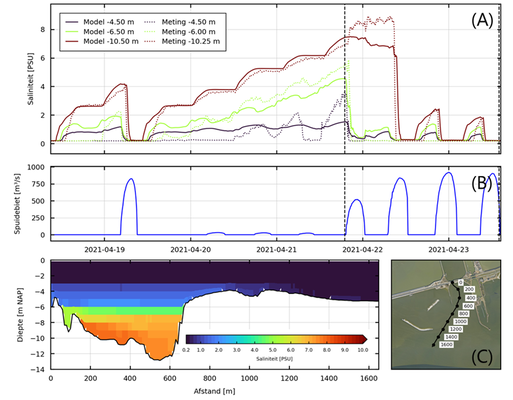
Figure 1: (A) Comparison between computed and measured salinity at different heights at the measurement location in Lake IJssel, south of Kornwerderzand for (B) a lock discharge time series in April-2021. (C) Computed spatial changes of salinity along a transect cross to the dike.
Morphological effects of salt marsh rejuvenation in Zuidgors (Western Scheldt)
J.C. de Smit1,*, V.A. Bax1, C.H. Cheng1, B. Walles1, W.I. van de Lageweg1
1 HZ University of Applied Sciences, Middelburg, The Netherlands
* Corresponding author: jaco.de.smit@hz.nl
Introduction
Old salt marshes are often dominated by sea couch (Elytrigia atherica), resulting in homogeneous landscapes with limited biodiversity. The dominance of sea couch can be controlled by grazing, but in the Southwestern Delta most salt marshes are unsuited for grazers. An alternative solution is to remove the top layer of the old salt marsh to promote the development of a new pioneer zone. This solution is only applied in small areas to ensure that enough high marsh remains for breeding birds. To realize N2000 quality goals, measures like this may need to be implemented more frequently in the future. It is therefore important to know how (quickly) the salt marsh recovers after a rejuvenation, and how the rejuvenation influences the morphodynamics of the (surrounding) salt marsh.
Objective and Methods
In 2020, a 120 x 220 m section of the salt marsh of Zuidgors was lowered from 2.5 m NAP to 2 m NAP. The rejuvenated area has since been enclosed by a small dyke and connected with the surrounding salt marsh via culverts. Institutes including the HZ University of Applied Sciences, the Netherlands Institute for Sea Research, and Wageningen Marine Research are actively monitoring the development of the rejuvenated area and its direct surroundings. The HZ has been conducting dGPS elevation measurements along transects and nearby creeks to observe the morphological recovery following the modification to the marsh. In addition, flow measurements (using Nortek ECO ADCP’s) have been conducted during stormy and normal conditions to assess flow pathways and water exchange between the rejuvenated area and surrounding creek system.
Results
Pioneer species including Salicornia europaea and Spartina anglica, and mid-marsh species such as Atrixplex halimus rapidly established within the rejuvenated area and are still the dominating species. Bed elevation recovery within the rejuvenated zone has been slow. So far, no significant increase in bed elevation in the pioneer zone has been observed. Also on the surrounding salt marsh platform there has been no noticeable development in bed elevation as a result of the salt marsh rejuvenation.
The creeks are, however, developing more actively. Creeks connected to the rejuvenation have been eroding prior to the rejuvenation, but now are eroding more rapidly. In contrast, other nearby creeks are silting up as a result of sedimentation on the adjacent tidal flat. At present, it is unclear whether the erosion is a result of the rejuvenation effort alone, as the creek system recently became connected to a creek on the tidal flat. ADCP measurements within the eroding creek system show a strong ebb-dominance, especially after a surge, which could explain the observed erosion. This could be exacerbated by the rejuvenated area, which acts as a tidal pool inducing prolonged drainage via the culverts into the tidal creeks after spring tides and / or storms.
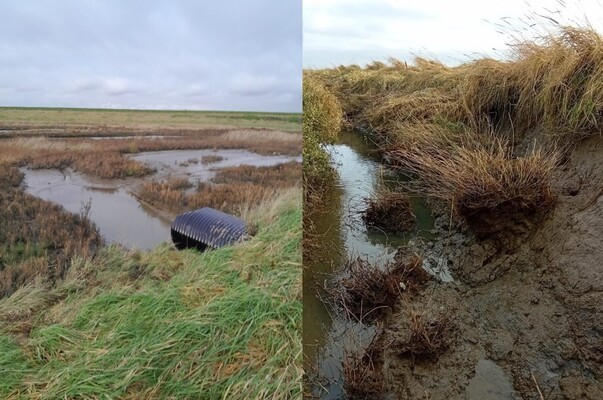
Left: an impression of the rejuvenated area in Zuidgors. Right: bank erosion in a nearby creek on the salt marsh.
Long-term beach-dune evolution of mega-nourishments - a Cellular Automata approach
M. Teixeira*, E.M. Horstman, K.M. Wijnberg
University of Twente, The Netherlands
* Corresponding author: m.teixeiramanion@utwente.nl
Introduction
Coastal sand nourishments have become a widespread strategy in response to coastal erosion and the need to strengthen coastal dunes for flood protection. Recently, a new strategy has been tested by upscaling from frequently recurring small-scale sand nourishments to a one-off local mega-nourishment (e.g. the Sand Motor). Such large volumes can significantly modify the natural beach-dune morphology, leading to an uncertain impact on its long-term evolution. Mega-nourishments may result in elevated berms and steeper cross-shore profiles that can alter the aeolian sand transport from the beach to the dunes, with the elevated berm leading to the formation of scarps through wave erosion (van Bemmelen et al., 2020). Furthermore, a mega-nourishment creates a planform perturbation of the coastline that will spread out in the alongshore direction, retreating locally whilst feeding the nearby coastline (Arriaga et al., 2017). Lastly, the use of coarser sediments in mega-nourishment construction may lead to the development of an armour layer on the beach, limiting aeolian transport (Hoonhout and de Vries, 2017). It is challenging to quantify and predict the development of mega-nourishments due to the diverse feedbacks involving aeolian dynamics, beach hydro- and morphodynamics, and vegetation development.
Objective and Methods
This study aims to enhance our understanding of how the morphological disturbances induced by mega-nourishments affect the long-term evolution of the beach-dune system. We investigate how the elevated berm, shoreline retreat, and beach armouring following a mega-nourishment affect dune emergence on the beach and foredune volume evolution.
We used the DuBeVeg model (Keijsers et al., 2016), a Cellular Automata model that includes the effects of aeolian transport, hydrodynamic erosion and accretion, and vegetation growth. Specifically, we used the modified DuBeVeg version of Teixeira et al. (2023) that considers saltation as the aeolian transport mode. The model was extended to include the coastline development and the effect of surface armouring on the beach. The model was validated by comparing its predictions with the measured morphodynamics of the Sand Motor.
Simulations were conducted for a 50-year period across four scenarios: the default scenario, representative of Sand Motor conditions with a high central berm and surface armouring; the high diffusion scenario, exploring the effect of accelerated shoreline diffusion; the no armouring scenario, examining the consequences of the absence of surface armouring; and the low platform scenario, investigating the impact of a lower, more hydrodynamically exposed berm.
Results
Results for the default scenario showed a seaward expansion of the initial dune zone, connecting and evolving from the isolated embryonic dunes that emerged during the first years on the upper beach (Figure 1a,b). The area occupied by new dunes stabilized after 20 years (Figure 1c), indicating a transition from the emergence of new embryonic dunes to the growth of already established dunes. The total dune volume (considered as the volume above a 5 m +MSL plane) continued increasing (Figure 1d).
The no armouring scenario led to a 12% larger area occupied by new dunes, indicating that the absence of the armouring limitation resulted in the emergence of more and/or larger embryonic dunes. However, this scenario resulted in a 2% lower total dune volume after 50 years, due to the larger amount of sediment captured by emerged embryonic dunes on the beach, hindering sediment transport to the dunes. Alternatively, the low platform scenario resulted in 14% less dune area than the default scenario due to the beach exposure to hydrodynamic action, but the total dune volume after 50 years was 3 % larger.
These results underline the model’s utility for exploring design optimization for mega-nourishments.
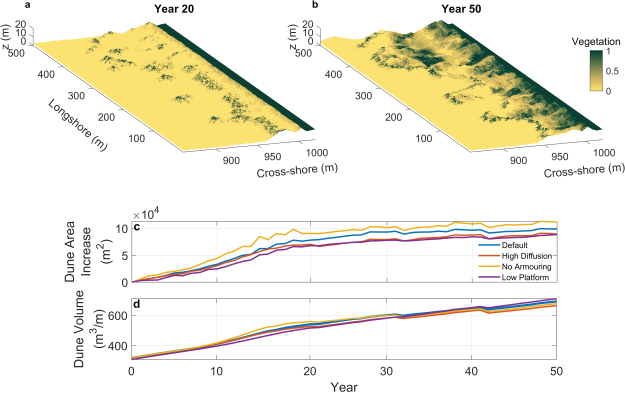
DuBeVeg simulation results for the beach-dune evolution after a mega-nourishment: simulated surface evolution of the default scenario after (a) 20 and (b) 50 years; the long-term evolution of (c) the area occupied by new dunes (emergent new dunes and extension of the original foredune) and (d) the total dune volume for all scenarios
References
Arriaga, J., Rutten, J., Ribas, F., Falqués, A., Ruessink, G., (2017), Modeling the long-term diffusion and feeding capability of a mega - nourishment. Coastal Engineering, 121, 1–13.
Hoonhout, B., de Vries, S., (2017), Field measurements on spatial variations in aeolian sediment availability at the Sand Motor mega nourishment. Aeolian Research, 24, 93–104.
Keijsers, J.G.S., Groot, A.V. de, Riksen, M.J.P.M., (2016), Modeling the biogeomorphic evolution of coastal dunes in response to climate change. Journal of Geophysical Research: Earth Surface, 121, 1161–1181.
Teixeira, M., Horstman, E.M., Wijnberg, K.M., (2023), Conceptualizing Aeolian Sediment Transport in a Cellular Automata Model to Simulate the Bio-Geomorphological Evolution of Beach – Dune Systems. Journal of Marine Science and Engineering, 11, 1278.
van Bemmelen, C.W.T., de Schipper, M.A., Darnall, J., Aarninkhof, S.G.J., (2020), Beach scarp dynamics at nourished beaches. Coastal Engineering, 160, 103725.
A decade of research reveals the tidal flat erosion mitigation abilities of oyster reefs
B. Walles1*, B.C. van Prooijen2 , W.I. van de Lageweg1
1 Department of Technology, Water & Environment, Building with Nature Research Group, HZ University of Applied Sciences, The Netherlands
2Faculty of Civil Engineering and Geosciences, Delft University of Technology, The Netherlands
* Corresponding author: brenda.walles@hz.nl
Introduction
Globally, numerous oyster reefs are built for shoreline protection, but success varies widely. Existing studies either explore wave attenuation by oyster reefs or ecological constraints independently. As such, integration of engineering and ecological knowledge is lacking, hindering effective translation into erosion-control measures. To optimize oyster reef design as a nature-based erosion control measure in the face of climate change, it is essential to comprehend how wave attenuation mitigates erosion along the shoreline profile, considering oysters' ecological constraints. This holistic understanding will maximize both ecological and engineering outcomes in the application of oyster reefs for nature-based erosion control.
Objective and Methods
In 2010, three large scale (200m x 8m x 0.25m) oyster reefs were built in the Oosterschelde estuary as mitigation measure to counteract tidal flat erosion. Over the course of a decade, we measured reef development (recruitment, growth and survival), wave attenuation (in the close proximity of the reef (2010) and along a transect (2020)) and morphological changes in the area. Based on this long-term monitoring, crucial lessons were learned for advancing sustainable flood management strategies and gaining societal acceptance. By utilizing the data and insights, it is possible to model and validate the potential of a reef structure as an erosion control measure under various environmental conditions. As an example we demonstrate how reefs can be used as erosion mitigation measure at the Galgeplaat, a tidal shoal in the Oosterschelde which will be nourished in 2026. Oysters’ ecological constrain will determine where structures can last for decades and grow at the pace of sea level rise. Local bathymetry, erosion rate and wave climate will dictate to what extent reefs add to erosion control.
Results
One out of the three constructed reefs is still growing, whereas the others cease to exist. Emersion time is crucial for reef development and survival1. By applying this knowledge to four reefs in 2013 (Oesterdam), they are still present today. Reefs attenuate waves, which holds for hundreds of meters leeward of the reef. Wave attenuation by reefs is however, water-depth dependent. In microtidal systems, reefs can effectively reduce waves all the way to the shoreline; however, in mesotidal systems like the Oosterschelde, they only mitigate waves below a specific water level. Despite this, they do play an important role in erosion mitigation. At the Galgeplaat, reefs can provide protection to the lower part of the shoal at locations unsuitable for nourishments. While restricted to the lower intertidal zone, reefs serve as a crucial starting point in a cascade of ecosystems that collectively enhance coastal protection. More emphasis needs to be on how this adds to coastal resilience, as loss of one ecosystem threatens the next, as well as its ability to provide coastal protection. We pinpointed crucial parameters for designing, situating and optimizing nature-based defenses, advancing the knowledge of strategically placing restoration efforts.
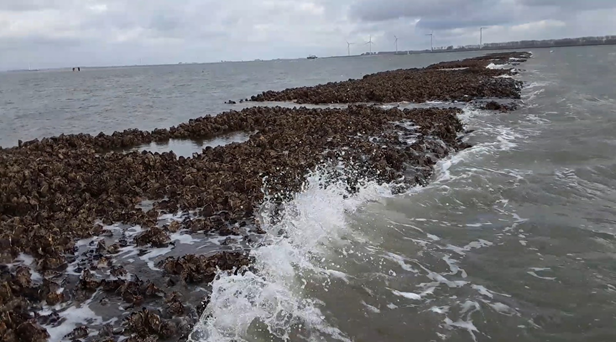
Waves breaking on a decade old oyster reef at the Slikken van Viane in the Oosterschelde (Photo credits: Brenda Walles).
References
1Walles, B., Troost, K., van den Ende, D., Nieuwhof, S., Smaal, A.C., Ysebaert, T (2016). From artificial structures to self-sustaining oyster reefs. Journal of Sea Research: 108: 1-9 https://doi.org/10.1016/j.seares.2015.11.007.
Exploring mangrove restoration strategies to optimize carbon sequestration potential
S.M. Beselly1,2,3*, M. van Der Wegen1,4 , J. Reyns1,2,4, U. Grueters5,J.D. Dijkstra4,D. Roelvink1,2,4*
1 IHE Delft Institute for Water Education, the Netherlands; 2 Delft University of Technology, the Netherlands; 3 Universitas Brawijaya, Indonesia; 4 Deltares, the Netherlands; 5 Justus Liebig University Giessen, Germany
* Corresponding author: s.beselly@un-ihe.org
Introduction
There is global recognition to push forward mangrove restoration and conservation for climate mitigation and adaptation. This is owing to the multiple ecosystem services provided by mangrove ecosystems, e.g., sustainable coastal protection and high carbon sequestration capacity that potentially reach up to five times more than terrestrial forests. Unfortunately, although our understanding of mangrove processes has significantly improved, 80-90% of the reported restoration projects have experienced failures. Successful restorations require a set of systematic and structured stages consisting of planning, implementation, and evaluation. Once the suitable site is available, ensuring successful mangrove establishment is another challenge, regardless of different approaches used, e.g., ecological restoration, assisted rehabilitation/ planting, or community-based ecological mangrove. The main cause is a mismatch of mangrove species and a poor understanding of wetland hydro-morphological systems and ecological elements. Guidelines exist; however, they may be site-specific and cannot be easily replicated in other restoration cases. Hence, it emphasizes the need for a mechanistic understanding of mangrove ecosystem physical and ecological interactions.
Objective and Methods
In this research, we investigate the restoration strategies concerning mangrove configuration and response of mangrove attribute trajectories to optimize the carbon sequestration function. We apply a mechanistic and spatially explicit mangrove-eco-morphodynamic model, coupling the Delft3D-FM with the MesoFON model (Beselly et al., 2023). The model can describe mangrove-mudflat dynamics, including the life stage progression (mangrove establishment, growth, and mortality) along with the systems’ morphodynamic evolution conditioned by wave and tidal forcing, sediment availability, bed level change, and salinity. We used an idealized muddy open coast with a mudflat slope of 1:1000 forced by spring-neap tides and a single-wave climate. Eco-morphodynamic simulation resembling active reforestation is initiated with mixed species seedlings of Avicennia marina and Rhizopora apiculata planted at 3m distance intervals. We apply various configurations of mangrove placements, including single (200m) and multiple (100m with 160m gap) patches placed at a particular vertical level related to the tide (mean sea level, mean high water spring, and mean high water neap).
Results
Overall, our simulations show a large impact of planting zonation where it redistributes sediment across mudflat, with seaward erosion and in-forest-landward deposition. The presence of mangroves facilitates vertical accretion rate in the forest interior by up to twice compared to the no-vegetation scenario. There is a strong correlation between the relative position of the planting and Mean Sea Level (MSL) elevation. The scenario with mangroves near the MSL shows profound erosion at the seaward fringe. Meanwhile, scenarios above Mean High Water Neap have less erosion, and deposition is limited following the forest interior. Planting mangroves in patches and gaps has increased mangrove biomass development, expansion, and sediment accumulation compared to those planted in the lower elevation. We find total carbon stock capacity in patches and gap scenarios at higher elevations, which generally accumulate more than a single patch at lower levels. Within the same period, the single patch reaches its optimum capacity. Meanwhile, the multi-patches and gaps tend to keep expanding and accumulate sediment and biomass. Simulation results indicate the high dependency of sediment loss-gain on total carbon sequestration stocks. Therefore, it emphasizes the planting zonation suitability analysis to prevent counterintuitive carbon sequestration potential.
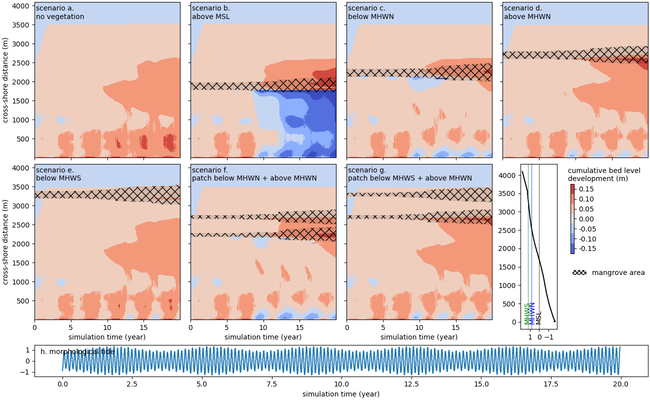
Simulated alongshore averaged bed level development. Panels show the spatiotemporal cumulative bed level development in each scenario. Mangrove extent is shown as black hatches on top of the bed level graph. Panel h shows the ocean boundary with morphological spring-neap tide forcing
References
Beselly, S.M., Grueters, U., Van Der Wegen, M., Reyns, J., Dijkstra, J., Roelvink, D., 2023. Modelling mangrove-mudflat dynamics with a coupled individual-based-hydro-morphodynamic model. Environ. Model. Softw. 169, 105814. https://doi.org/10.1016/j.envsoft.2023.105814
Mangrove Ecosystem Engineering Effects Across an Elevation Gradient with Forest Zones
R. Gijsman1*, E.M. Horstman1, A. Swales2, D. van der Wal1,3 and K.M. Wijnberg1
1 University of Twente, The Netherlands; 2 NIWA, New Zealand; 3 NIOZ, The Netherlands
* Corresponding author: rik.gijsman@utwente.nl
Introduction
Mangroves reduce energy of long and short-period waves with their above-ground biomass, while they increase soil binding and stability of intertidal flats with their below-ground biomass. This ‘ecosystem engineering’ capacity of mangroves can support shoreline stabilization and forest recovery and development, thereby enhancing their persistence to reduce coastal flood risk (Gijsman et al., 2021). The persistence of mangroves under environmental change is an important reason for the recognition of mangroves as a Nature-based Solution (NbS) for coastal flood risk reduction. However, there is limited quantitative knowledge on how ecosystem engineering of mangroves influences the development of mangrove forests and, as a result, their persistence (Gijsman et al., 2023). Consequently, the persistence of mangrove forests over seasonal to decadal timescales cannot yet be predicted with sufficient confidence so that they can be applied in coastal engineering and management for flood risk reduction.
Objective and Methods
This study aims to develop quantitative knowledge of mangrove ecosystem engineering effects through a biophysical process-based numerical modeling approach. The model is developed with a comprehensive dataset of hydrodynamic, morphodynamic and vegetation parameters collected for over a decade in the Firth of Thames estuary in Aotearoa New Zealand (hereafter Firth). The hydro- and morphodynamic model is setup in Delft3D Flexible Mesh and includes the influence of mangroves’ above-ground biomass (enhancing drag) and their below-ground biomass (stabilizing the bed), as well as the ecological process of seedling recruitment. The Firth is a sediment-rich and wave-dominated estuary with an alongshore uniform, mono-species mangrove forest (Avicennia marina var. australasica). The mangrove forest in the Firth is characterized by distinct cross-shore zones with different elevation and vegetation characteristics: from the most seaward intertidal flat, to the seedling establishment zone, the dynamic forest fringe, the scrub forest and, most landward, the relict forest fringe (Figure 1A) (Swales et al., 2019). Manipulated model simulations with and without mangroves’ effects on hydrodynamics and morphodynamics were performed to quantify their influence on the profile morphology (i.e., sediment accretion) and on forest recovery and development (i.e., seedling survival probability) in these different cross-shore zones on an annual timescale.
Results
The model simulations identified three distinct cross-shore zones for the mangrove ecosystem engineering effects on the morphodynamics and forest recovery and development: the lower-elevated unvegetated intertidal flat and sparsely-vegetated seedling establishment zone, characterized by daily tidal inundation (zone 1: the mudflat); the mid-elevation denser-vegetated dynamic forest fringe, characterized by daily to biweekly tidal inundation (zone 2: the fringe); and at the highest elevation, the densely-vegetated scrub forest and relict forest fringe, with fewer than biweekly tidal inundation (zone 3: the forest}. The presence of mangrove trees increases sediment accretion in the fringe, up to a distance of approximately 200 m landward from the forest fringe/mudflat transition (Figure 1B). The presence of mangrove trees also enhances the survival probability of seedlings, and this effect extended about 400 m landward of the forest fringe/mudflat transition (Figure 1C). The existing upper intertidal platform morphology and forest zonation in the Firth were found to be directly related to these mangrove ecosystem engineering effects on sediment accretion and seedling recruitment. Overall, the results showed that the effects of mangrove ecosystem engineering contribute to forest fringe development and widening of the vegetated upper intertidal platform, thus enabling mangrove persistence to reduce coastal flood risk.
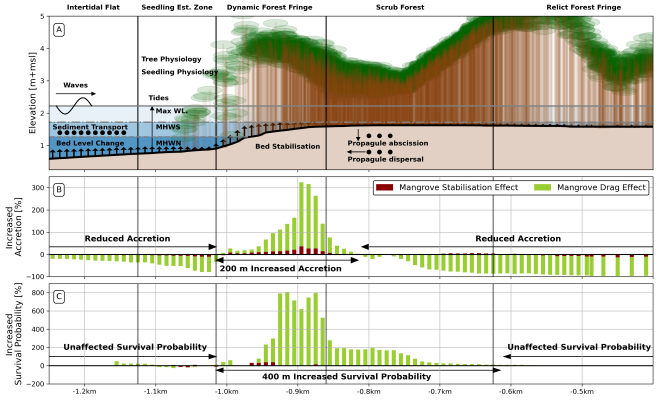
Figure 1: (A) Mangrove ecosystem engineering effects on sediment accretion and seedling survival probability in the Firth of Thames at an annual scale. (B) Effects of mangrove bed stabilization and drag on vertical sediment accretion and (C) seedling survival probability are presented relative to simulation results for the same initial and boundary conditions but without mangrove tree effects.
References
Gijsman et al., (2021). Nature-Based Engineering: A Review on Reducing Coastal Flood Risk with Mangroves, Frontiers in Marine Science, 8, 825
Gijsman et al., (2023). Mangrove Drag and Bed Stabilisation Effects on Intertidal Flat Morphology, Earth Surface Processes and Landforms, 1-18
Swales et al., (2019). Landscape evolution of a fluvial sediment-rich avicennia marina mangrove forest: insights from seasonal and inter-annual surface-elevation dynamics. Ecosystems 22, 1232-1255
The North Manila Bay Flood Protection Strategy with NBS
B.M.L.de Vries1
1Royal HaskoningDHV, The Netherlands
Corresponding author: bente.de.vries@haskoningdhv.com
Introduction
Over the next 40 years, the urban area in the catchment of Manila Bay is expected to have roughly doubled, with a population increase from 33 million people in 2015 to about 51 million people by 2050. This requires the greatest attention of the Government of the Philippines to adequately regulate the spatial and master plans.
One of the priority measures of the Manila Bay Sustainable Development Masterplan is to drastically reduce the exposure of people, properties, and livelihood to flooding, especially informal settler families in hazard-prone areas. This is achieved by establishing a Coastal Line of Defence (CLD), relocating residents in extreme-subsiding barangays (i.e., seaward of the CLD) and implementing nature-based coastal protection programmes.
Royal HaskoningDHV was contracted to identify sustainable, nature-based flood protection measures as part of a Flood Protection Strategy for the north of Manila Bay, which ties in with the Sustainable Development Master Plan (MBSDMP). The project was initiated and funded by the government of the Netherlands, through its Partners for Water program.
Objective and Methods
The goal of the North Manila Bay Flood Protection Strategy is: "To develop a Flood Protection Strategy which identifies sustainable, nature-based flood protection measures for the Northern Manila Bay coastal area, and to recommend pilot locations for implementation of these measures."
The foundation of the protection strategy is a root cause analysis of the flooding problems. In addition, a total of approximately 50 meetings/workshops were held to collect input and opinions from over 20 different stakeholders. This was done to involve them in the decision-making process and ensure sustainable outcomes. Priority areas were defined and assessed for exposure to various flood related criteria. A longlist of Nature-based Solutions (NBS) was created, which were scored on effect on coastal and river flooding, storm surges wave attack, property and livelihood damage, environmental impact, institutional complexity, and social impact. The above input along with inspiration from EcoShape/Wetlands International’s earlier work, was combined to develop NBS overview maps. These maps show what the full implementation of the strategy would look like. Finally, pilot locations were identified to serve as a catalyst for implementing the strategy and Nature-based Solutions in the Philippines as a whole.
Results
The main result is a flood protection strategy for Manila Bay that can be used by the various stakeholders in the area. It focuses on a practical institutional setup and small-scale projects to initiate the strategy.
Important root causes for the flooding problems included the decline of natural habitat, climate change-induced sea-level rise and land subsidence. Stakeholder input confirmed these causes and applicable Nature-based Solutions have been shaped accordingly. This resulted in twenty possible Nature-based Solutions and “soft-measures” that will positively impact the flood susceptibility of the region if implemented. The strategy acknowledges that there are many parallel and interfacing developments in the area. Coordination and alignment between these developments are fundamental for their individual success. The institutional setup considers a long-term scenario focused on the wider strategy implementation and a short-term scenario for pilot implementation.
The strategy shows that Nature-based Solutions are vital in providing protection from climate change impacts and other flood-related hazards. Simultaneously, they can facilitate a transition towards alternate/adaptable livelihoods and habitat restoration. In this way, the North Manila Bay Flood Protection Strategy contributes to increasing and restoring the biodiversity in the North Manila Bay area.
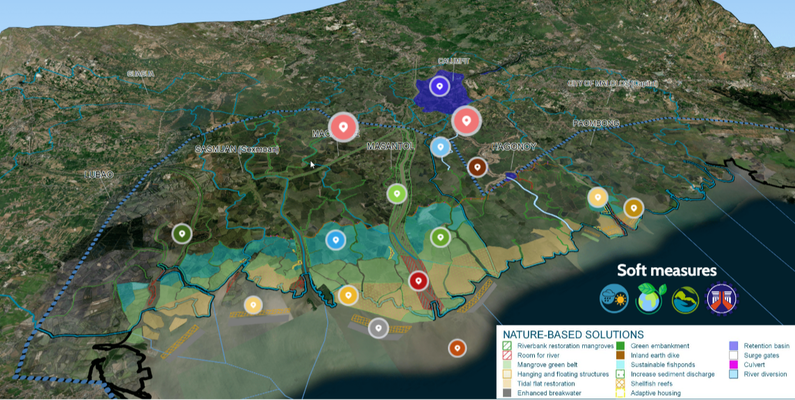
Map with Nature-based Solutions for North Manila Bay.
References
Nell, J. (2022). North Manila Bay Flood Protection Strategy. Royal HaskoningDHV, Netherlands Enterprise Agency.